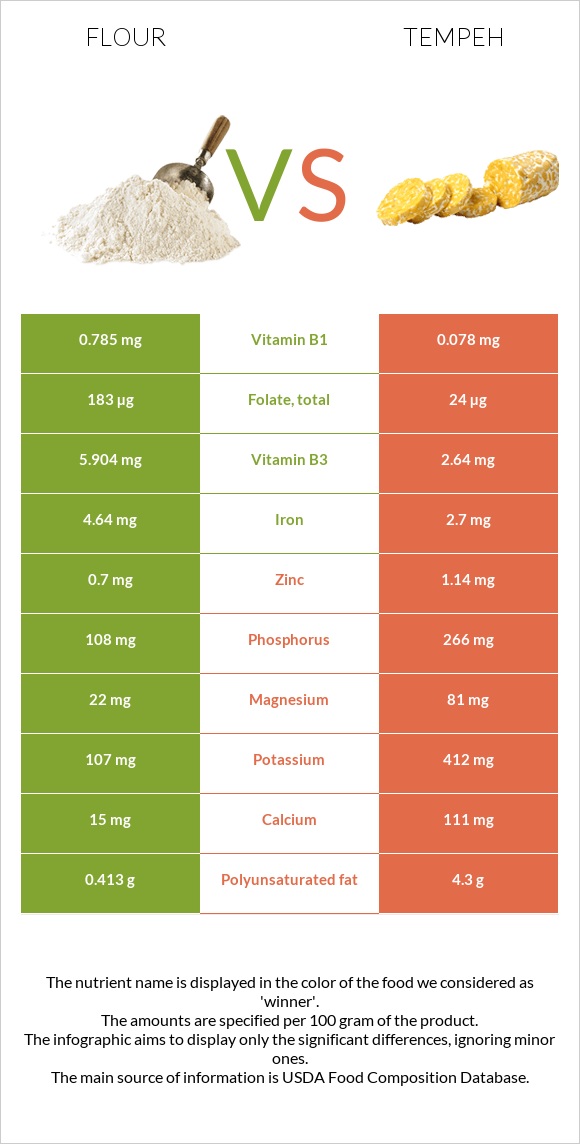
A recap on the differences between flour and tempeh Flour has more selenium, vitamin B1, folate, iron, and vitamin B3; however, tempeh is higher in copper, manganese, phosphorus, magnesium, and vitamin B6. Flour covers your daily selenium needs 62% more than tempeh. Tempeh contains 10 times less vitamin B1 than flour. Flour contains 0.785mg of vitamin B1, while tempeh contains 0.078mg. The glycemic index of flour is higher. Food varieties used in this article are Wheat flour, white, all-purpose, enriched, bleached and Tempeh .
Infographic
Mineral Comparison
Mineral comparison score is based on the number of minerals by which one or the other food is richer. The "coverage" charts below show how much of the daily needs can be covered by 300 grams of the food.
3
100 g
300 g
1 cup - 125g
Magnesium
Magnesium
Calcium
Calcium
Potassium
Potassium
Iron
Iron
Copper
Copper
Zinc
Zinc
Phosphorus
Phosphorus
Sodium
Sodium
Manganese
Manganese
Selenium
Selenium
16%
4.5%
9.4%
174%
48%
19%
46%
0.26%
89%
185%
7
100 g
300 g
1 cup - 166g
Magnesium
Magnesium
Calcium
Calcium
Potassium
Potassium
Iron
Iron
Copper
Copper
Zinc
Zinc
Phosphorus
Phosphorus
Sodium
Sodium
Manganese
Manganese
Selenium
Selenium
58%
33%
36%
101%
187%
31%
114%
1.2%
170%
0%
Vitamin Comparison
Vitamin comparison score is based on the number of vitamins by which one or the other food is richer. The "coverage" charts below show how much of the daily needs can be covered by 300 grams of the food.
7
100 g
300 g
1 cup - 125g
Vitamin C
Vit. C
Vitamin D
Vit. D
Vitamin A
Vit. A
Vitamin E
Vit. E
Vitamin B1
Vit. B1
Vitamin B2
Vit. B2
Vitamin B3
Vit. B3
Vitamin B5
Vit. B5
Vitamin B6
Vit. B6
Vitamin B12
Vit. B12
Vitamin K
Vit. K
Folate
Folate
0%
0%
0%
1.2%
196%
114%
111%
26%
10%
0%
0.75%
137%
2
100 g
300 g
1 cup - 166g
Vitamin C
Vit. C
Vitamin D
Vit. D
Vitamin A
Vit. A
Vitamin E
Vit. E
Vitamin B1
Vit. B1
Vitamin B2
Vit. B2
Vitamin B3
Vit. B3
Vitamin B5
Vit. B5
Vitamin B6
Vit. B6
Vitamin B12
Vit. B12
Vitamin K
Vit. K
Folate
Folate
0%
0%
0%
0%
20%
83%
50%
17%
50%
10%
0%
18%
All nutrients comparison - raw data values
Nutrient
DV% diff.
Selenium
33.9µg
0µg
62%
Vitamin B1
0.785mg
0.078mg
59%
Copper
0.144mg
0.56mg
46%
Folate
183µg
24µg
40%
Manganese
0.682mg
1.3mg
27%
Polyunsaturated fat
0.413g
4.3g
26%
Iron
4.64mg
2.7mg
24%
Carbs
76.31g
7.64g
23%
Phosphorus
108mg
266mg
23%
Protein
10.33g
20.29g
20%
Vitamin B3
5.904mg
2.64mg
20%
Fats
0.98g
10.8g
15%
Magnesium
22mg
81mg
14%
Vitamin B6
0.044mg
0.215mg
13%
Fiber
2.7g
11%
Saturated fat
0.155g
2.539g
11%
Calcium
15mg
111mg
10%
Vitamin B2
0.494mg
0.358mg
10%
Calories
364kcal
192kcal
9%
Potassium
107mg
412mg
9%
Monounsaturated fat
0.087g
3.205g
8%
Zinc
0.7mg
1.14mg
4%
Vitamin B5
0.438mg
0.278mg
3%
Vitamin B12
0µg
0.08µg
3%
Choline
10.4mg
2%
Protein per 100 calories
2.8g
11g
N/A
Calories per 10 g protein
352kcal
95kcal
N/A
Weight per 100 calories
27g
52g
N/A
Unsaturated / Saturated Fat ratio
3.2
3
N/A
Net carbs
73.61g
7.64g
N/A
Sugar
0.27g
N/A
Sodium
2mg
9mg
0%
Vitamin E
0.06mg
0%
Vitamin K
0.3µg
0%
Tryptophan
0.127mg
0.194mg
0%
Threonine
0.281mg
0.796mg
0%
Isoleucine
0.357mg
0.88mg
0%
Leucine
0.71mg
1.43mg
0%
Lysine
0.228mg
0.908mg
0%
Methionine
0.183mg
0.175mg
0%
Phenylalanine
0.52mg
0.893mg
0%
Valine
0.415mg
0.92mg
0%
Histidine
0.23mg
0.466mg
0%
Macronutrient Comparison
Macronutrient breakdown side-by-side comparison
1
10%
76%
12%
Protein:
10.33 g
Fats:
0.98 g
Carbs:
76.31 g
Water:
11.92 g
Other:
0.46 g
4
20%
11%
8%
60%
Protein:
20.29 g
Fats:
10.8 g
Carbs:
7.64 g
Water:
59.65 g
Other:
1.62 g
Contains
more
Carbs Carbs
+898.8%
Contains
more
Protein Protein
+96.4%
Contains
more
Fats Fats
+1002%
Contains
more
Water Water
+400.4%
Contains
more
Other Other
+252.2%
Fat Type Comparison
Fat type breakdown side-by-side comparison
1
24%
13%
63%
Saturated fat:
Sat. Fat
0.155 g
Monounsaturated fat:
Mono. Fat
0.087 g
Polyunsaturated fat:
Poly. Fat
0.413 g
2
25%
32%
43%
Saturated fat:
Sat. Fat
2.539 g
Monounsaturated fat:
Mono. Fat
3.205 g
Polyunsaturated fat:
Poly. Fat
4.3 g
Contains
less
Sat. Fat Saturated fat
-93.9%
Contains
more
Mono. Fat Monounsaturated fat
+3583.9%
Contains
more
Poly. Fat Polyunsaturated fat
+941.2%