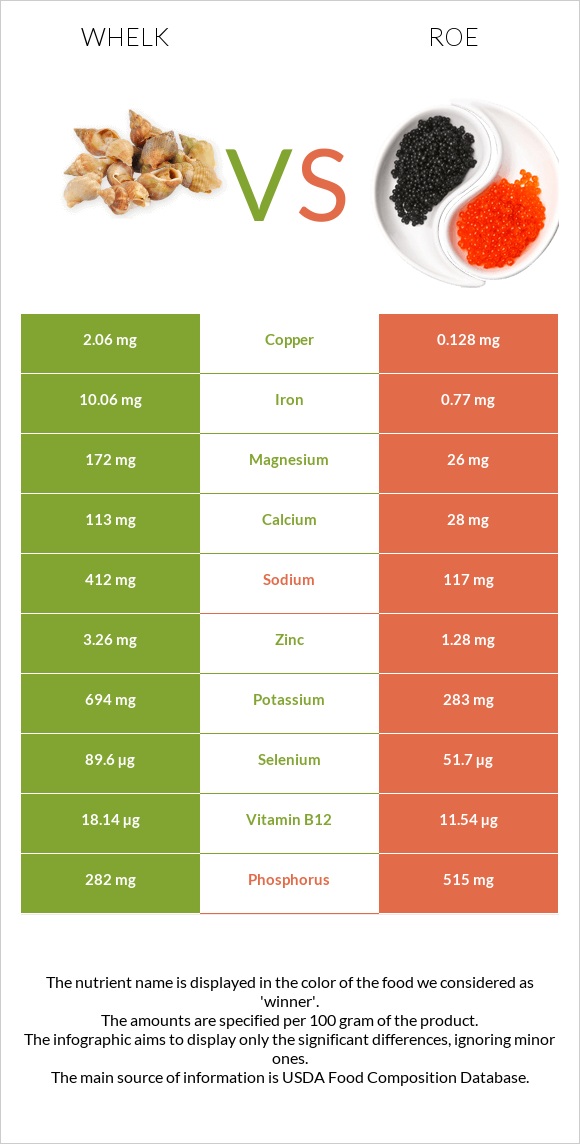
A recap on the differences between whelk and roe Whelk is higher in vitamin B12, copper, iron, selenium, manganese, vitamin B6, and magnesium, yet roe is higher in vitamin B2 and phosphorus. Whelk covers your daily vitamin B12 needs 275% more than roe. Whelk contains 68 times more manganese than roe. While whelk contains 0.89mg of manganese, roe contains only 0.013mg. The amount of cholesterol in whelk is lower. Food varieties used in this article are Mollusks, whelk, unspecified, cooked, moist heat and Fish, roe, mixed species, cooked, dry heat .
Infographic
Mineral Comparison
Mineral comparison score is based on the number of minerals by which one or the other food is richer. The "coverage" charts below show how much of the daily needs can be covered by 300 grams of the food.
8
100 g
300 g
3 oz - 85g
Magnesium
Magnesium
Calcium
Calcium
Potassium
Potassium
Iron
Iron
Copper
Copper
Zinc
Zinc
Phosphorus
Phosphorus
Sodium
Sodium
Manganese
Manganese
Selenium
Selenium
123%
34%
61%
377%
687%
89%
121%
54%
116%
489%
2
100 g
300 g
1 oz - 28.35g 3 oz - 85g
Magnesium
Magnesium
Calcium
Calcium
Potassium
Potassium
Iron
Iron
Copper
Copper
Zinc
Zinc
Phosphorus
Phosphorus
Sodium
Sodium
Manganese
Manganese
Selenium
Selenium
19%
8.4%
25%
29%
43%
35%
221%
15%
1.7%
282%
Vitamin Comparison
Vitamin comparison score is based on the number of vitamins by which one or the other food is richer. The "coverage" charts below show how much of the daily needs can be covered by 300 grams of the food.
2
100 g
300 g
3 oz - 85g
Vitamin C
Vit. C
Vitamin D
Vit. D
Vitamin A
Vit. A
Vitamin E
Vit. E
Vitamin B1
Vit. B1
Vitamin B2
Vit. B2
Vitamin B3
Vit. B3
Vitamin B5
Vit. B5
Vitamin B6
Vit. B6
Vitamin B12
Vit. B12
Vitamin K
Vit. K
Folate
Folate
23%
0%
16%
0%
12%
49%
37%
24%
150%
2268%
0%
8.3%
6
100 g
300 g
1 oz - 28.35g 3 oz - 85g
Vitamin C
Vit. C
Vitamin D
Vit. D
Vitamin A
Vit. A
Vitamin E
Vit. E
Vitamin B1
Vit. B1
Vitamin B2
Vit. B2
Vitamin B3
Vit. B3
Vitamin B5
Vit. B5
Vitamin B6
Vit. B6
Vitamin B12
Vit. B12
Vitamin K
Vit. K
Folate
Folate
55%
0%
30%
0%
69%
219%
41%
69%
43%
1443%
0%
69%
All nutrients comparison - raw data values
Nutrient
DV% diff.
Vitamin B12
18.14µg
11.54µg
275%
Copper
2.06mg
0.128mg
215%
Cholesterol
130mg
479mg
116%
Iron
10.06mg
0.77mg
116%
Selenium
89.6µg
51.7µg
69%
Vitamin B2
0.214mg
0.949mg
57%
Protein
47.68g
28.62g
38%
Manganese
0.89mg
0.013mg
38%
Vitamin B6
0.65mg
0.185mg
36%
Magnesium
172mg
26mg
35%
Phosphorus
282mg
515mg
33%
Polyunsaturated fat
0.046g
3.404g
22%
Folate
11µg
92µg
20%
Vitamin B1
0.049mg
0.277mg
19%
Zinc
3.26mg
1.28mg
18%
Vitamin B5
0.4mg
1.154mg
15%
Sodium
412mg
117mg
13%
Potassium
694mg
283mg
12%
Fats
0.8g
8.23g
11%
Vitamin C
6.8mg
16.4mg
11%
Calcium
113mg
28mg
9%
Saturated fat
0.062g
1.866g
8%
Carbs
15.52g
1.92g
5%
Vitamin A
49µg
91µg
5%
Monounsaturated fat
0.056g
2.129g
5%
Calories
275kcal
204kcal
4%
Vitamin B3
1.995mg
2.192mg
1%
Protein per 100 calories
17g
14g
N/A
Calories per 10 g protein
58kcal
71kcal
N/A
Weight per 100 calories
36g
49g
N/A
Unsaturated / Saturated Fat ratio
1.6
3
N/A
Net carbs
15.52g
1.92g
N/A
Tryptophan
0.618mg
0.375mg
0%
Threonine
2.136mg
1.305mg
0%
Isoleucine
1.655mg
1.465mg
0%
Leucine
3.807mg
2.509mg
0%
Lysine
2.93mg
2.179mg
0%
Methionine
1.205mg
0.71mg
0%
Phenylalanine
1.648mg
1.401mg
0%
Valine
2.075mg
1.676mg
0%
Histidine
0.977mg
0.778mg
0%
Omega-3 - EPA
0.008g
1.26g
N/A
Omega-3 - DHA
0.012g
1.747g
N/A
Omega-3 - DPA
0.105g
N/A
Macronutrient Comparison
Macronutrient breakdown side-by-side comparison
3
48%
16%
32%
4%
Protein:
47.68 g
Fats:
0.8 g
Carbs:
15.52 g
Water:
32 g
Other:
4 g
2
29%
8%
2%
59%
3%
Protein:
28.62 g
Fats:
8.23 g
Carbs:
1.92 g
Water:
58.63 g
Other:
2.6 g
Contains
more
Protein Protein
+66.6%
Contains
more
Carbs Carbs
+708.3%
Contains
more
Other Other
+53.8%
Contains
more
Fats Fats
+928.8%
Contains
more
Water Water
+83.2%
Fat Type Comparison
Fat type breakdown side-by-side comparison
1
38%
34%
28%
Saturated fat:
Sat. Fat
0.062 g
Monounsaturated fat:
Mono. Fat
0.056 g
Polyunsaturated fat:
Poly. Fat
0.046 g
2
25%
29%
46%
Saturated fat:
Sat. Fat
1.866 g
Monounsaturated fat:
Mono. Fat
2.129 g
Polyunsaturated fat:
Poly. Fat
3.404 g
Contains
less
Sat. Fat Saturated fat
-96.7%
Contains
more
Mono. Fat Monounsaturated fat
+3701.8%
Contains
more
Poly. Fat Polyunsaturated fat
+7300%