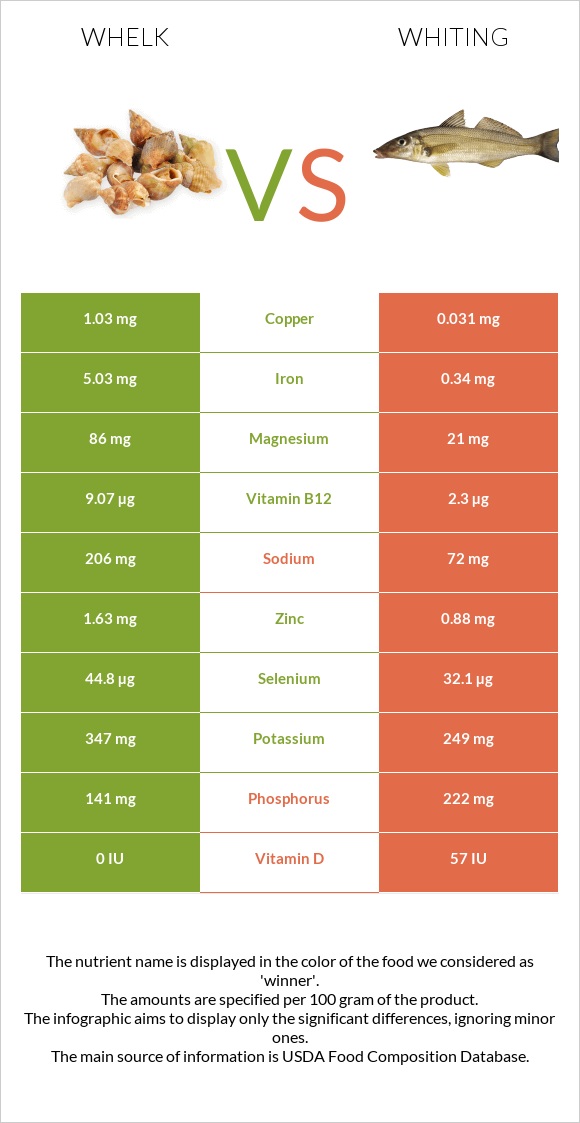
Differences between whelk and whiting Whiting contains less vitamin B12, copper, iron, selenium, vitamin B6, magnesium, manganese, and zinc than whelk. Whelk's daily need coverage for vitamin B12 is 648% higher. Whiting contains 52 times less copper than whelk. Whelk contains 2.06mg of copper, while whiting contains 0.04mg. The amount of sodium in whiting is lower. The food types used in this comparison are Mollusks, whelk, unspecified, cooked, moist heat and Fish, whiting, mixed species, cooked, dry heat .
Infographic
Mineral Comparison
Mineral comparison score is based on the number of minerals by which one or the other food is richer. The "coverage" charts below show how much of the daily needs can be covered by 300 grams of the food.
8
100 g
300 g
3 oz - 85g
Magnesium
Magnesium
Calcium
Calcium
Potassium
Potassium
Iron
Iron
Copper
Copper
Zinc
Zinc
Phosphorus
Phosphorus
Sodium
Sodium
Manganese
Manganese
Selenium
Selenium
123%
34%
61%
377%
687%
89%
121%
54%
116%
489%
1
100 g
300 g
1 fillet - 72g 3 oz - 85g
Magnesium
Magnesium
Calcium
Calcium
Potassium
Potassium
Iron
Iron
Copper
Copper
Zinc
Zinc
Phosphorus
Phosphorus
Sodium
Sodium
Manganese
Manganese
Selenium
Selenium
19%
19%
38%
16%
13%
14%
122%
17%
17%
224%
Vitamin Comparison
Vitamin comparison score is based on the number of vitamins by which one or the other food is richer. The "coverage" charts below show how much of the daily needs can be covered by 300 grams of the food.
7
100 g
300 g
3 oz - 85g
Vitamin C
Vit. C
Vitamin D
Vit. D
Vitamin A
Vit. A
Vitamin E
Vit. E
Vitamin B1
Vit. B1
Vitamin B2
Vit. B2
Vitamin B3
Vit. B3
Vitamin B5
Vit. B5
Vitamin B6
Vit. B6
Vitamin B12
Vit. B12
Vitamin K
Vit. K
Folate
Folate
23%
0%
16%
0%
12%
49%
37%
24%
150%
2268%
0%
8.3%
5
100 g
300 g
1 fillet - 72g 3 oz - 85g
Vitamin C
Vit. C
Vitamin D
Vit. D
Vitamin A
Vit. A
Vitamin E
Vit. E
Vitamin B1
Vit. B1
Vitamin B2
Vit. B2
Vitamin B3
Vit. B3
Vitamin B5
Vit. B5
Vitamin B6
Vit. B6
Vitamin B12
Vit. B12
Vitamin K
Vit. K
Folate
Folate
0%
27%
13%
7.6%
17%
14%
31%
15%
42%
325%
0.25%
11%
All nutrients comparison - raw data values
Nutrient
DV% diff.
Vitamin B12
18.14µg
2.6µg
648%
Copper
2.06mg
0.04mg
224%
Iron
10.06mg
0.42mg
121%
Selenium
89.6µg
41.1µg
88%
Protein
47.68g
23.48g
48%
Vitamin B6
0.65mg
0.18mg
36%
Magnesium
172mg
27mg
35%
Manganese
0.89mg
0.13mg
33%
Zinc
3.26mg
0.53mg
25%
Cholesterol
130mg
84mg
15%
Choline
83.3mg
15%
Sodium
412mg
132mg
12%
Vitamin B2
0.214mg
0.06mg
12%
Vitamin D*
73 IU
9%
Vitamin D
1.8µg
9%
Calories
275kcal
116kcal
8%
Vitamin C
6.8mg
0mg
8%
Potassium
694mg
434mg
8%
Carbs
15.52g
0g
5%
Calcium
113mg
62mg
5%
Polyunsaturated fat
0.046g
0.587g
4%
Vitamin E
0.38mg
3%
Vitamin B5
0.4mg
0.25mg
3%
Vitamin B1
0.049mg
0.068mg
2%
Vitamin B3
1.995mg
1.67mg
2%
Saturated fat
0.062g
0.4g
2%
Fats
0.8g
1.69g
1%
Vitamin A
49µg
38µg
1%
Folate
11µg
15µg
1%
Monounsaturated fat
0.056g
0.445g
1%
Protein per 100 calories
17g
20g
N/A
Calories per 10 g protein
58kcal
49kcal
N/A
Weight per 100 calories
36g
86g
N/A
Net carbs
15.52g
0g
N/A
Phosphorus
282mg
285mg
0%
Vitamin K
0.1µg
0%
Tryptophan
0.618mg
0.263mg
0%
Threonine
2.136mg
1.029mg
0%
Isoleucine
1.655mg
1.082mg
0%
Leucine
3.807mg
1.908mg
0%
Lysine
2.93mg
2.156mg
0%
Methionine
1.205mg
0.695mg
0%
Phenylalanine
1.648mg
0.917mg
0%
Valine
2.075mg
1.21mg
0%
Histidine
0.977mg
0.691mg
0%
Omega-3 - EPA
0.008g
0.283g
N/A
Omega-3 - DHA
0.012g
0.235g
N/A
Omega-3 - DPA
0.017g
N/A
Macronutrient Comparison
Macronutrient breakdown side-by-side comparison
3
48%
16%
32%
4%
Protein:
47.68 g
Fats:
0.8 g
Carbs:
15.52 g
Water:
32 g
Other:
4 g
2
23%
2%
75%
Protein:
23.48 g
Fats:
1.69 g
Carbs:
0 g
Water:
74.71 g
Other:
0.12 g
Contains
more
Protein Protein
+103.1%
Contains
more
Carbs Carbs
+∞%
Contains
more
Other Other
+3233.3%
Contains
more
Fats Fats
+111.3%
Contains
more
Water Water
+133.5%
Fat Type Comparison
Fat type breakdown side-by-side comparison
1
38%
34%
28%
Saturated fat:
Sat. Fat
0.062 g
Monounsaturated fat:
Mono. Fat
0.056 g
Polyunsaturated fat:
Poly. Fat
0.046 g
2
28%
31%
41%
Saturated fat:
Sat. Fat
0.4 g
Monounsaturated fat:
Mono. Fat
0.445 g
Polyunsaturated fat:
Poly. Fat
0.587 g
Contains
less
Sat. Fat Saturated fat
-84.5%
Contains
more
Mono. Fat Monounsaturated fat
+694.6%
Contains
more
Poly. Fat Polyunsaturated fat
+1176.1%