Hazelnut nutrition: calories, carbs, GI, protein, fiber, fats
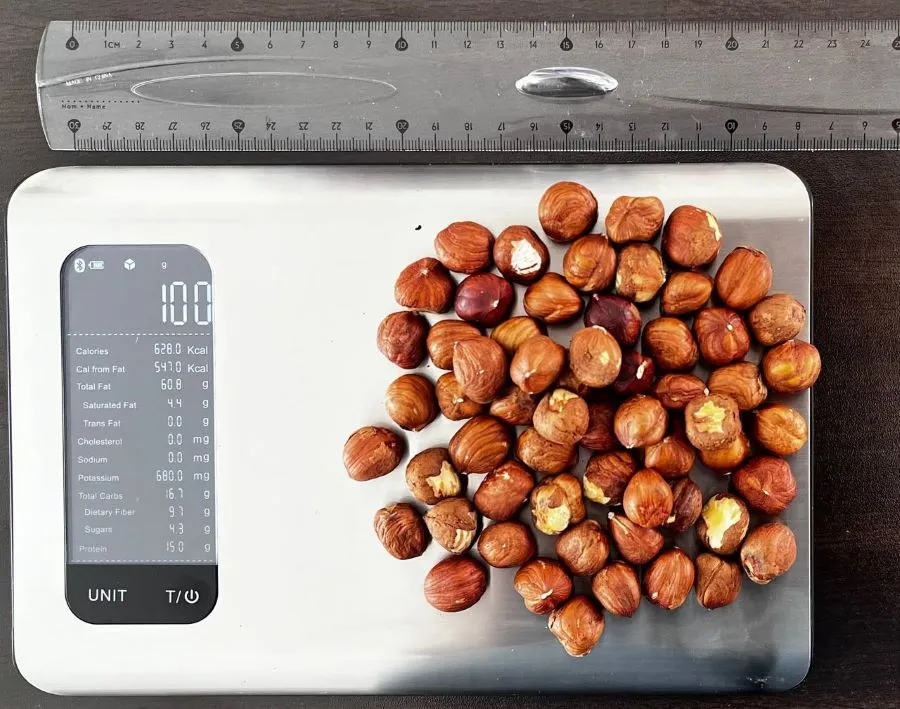
What Do 628 Calories or 100 Grams of Hazelnut Look Like?
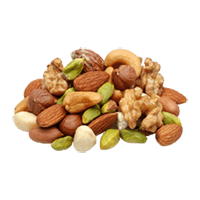
Our team measured how much 100 grams or 628 calories of hazelnuts look like. The picture below shows that 51 hazelnuts comprise 100 grams. That means each hazelnut is about 1.97 grams or approximately 12.3 calories.
Remember that the calorie count can change based on the weight, size, and whether you eat the hazelnuts raw or roasted. Roasted nuts are usually coated in unhealthy oils and sugar, which means they have extra calories that don't provide much nutrition.
The average serving size of hazelnuts is 28.35 grams, containing about 178 calories accordingly.
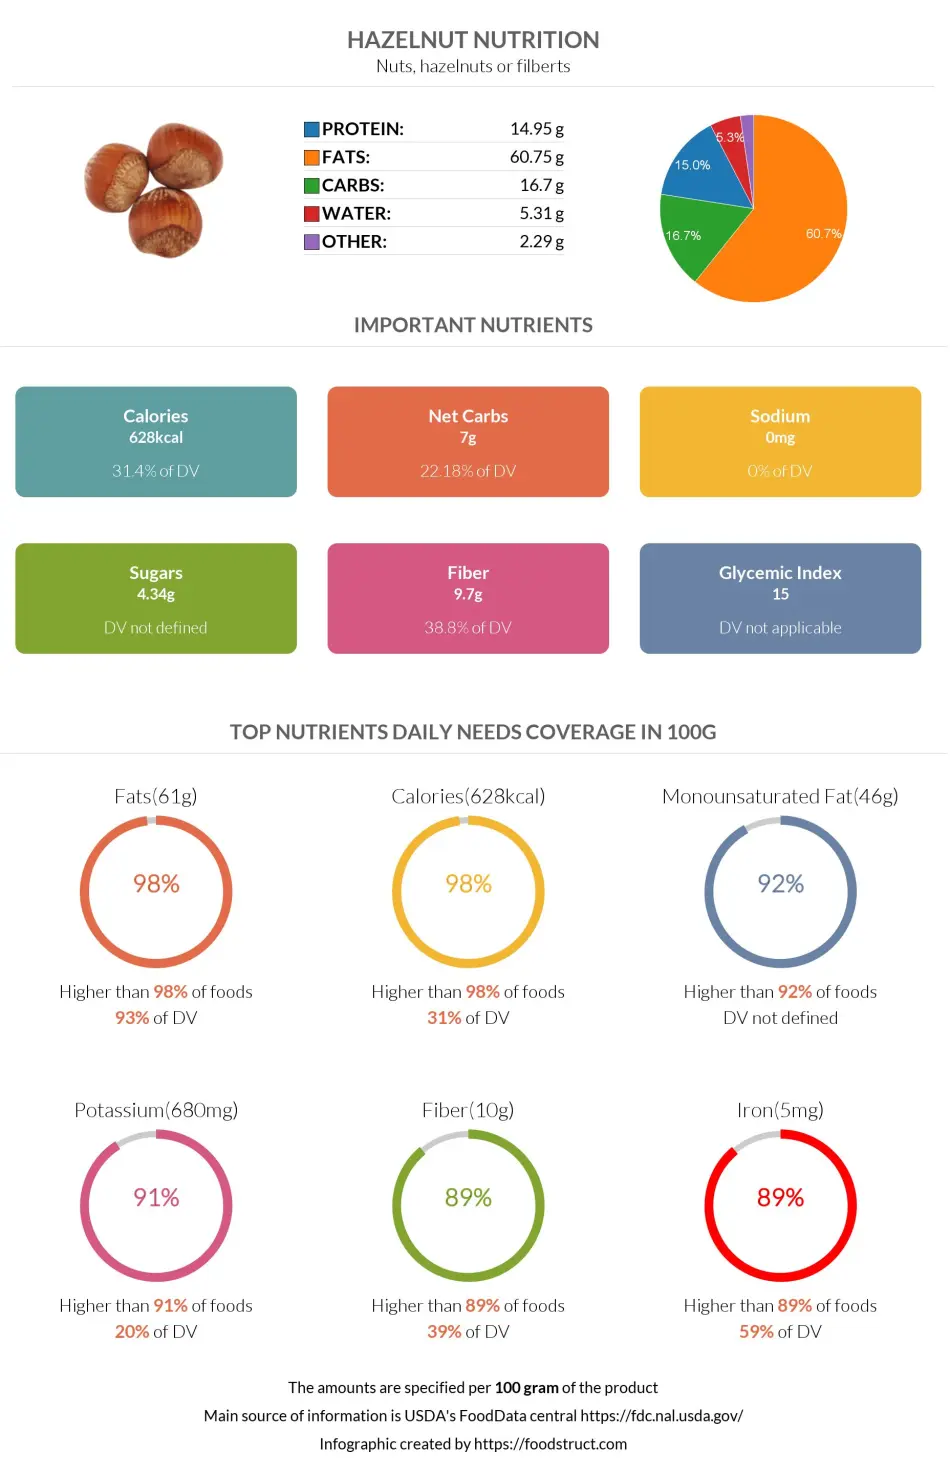
Important nutritional characteristics for Hazelnut
| Glycemic index ⓘ Gi values are taken from various scientific sources. GI values less than 55 are considered as low. Values above 70 are considered as high. | 15 (low) |
| Calories ⓘ Calories for selected serving | 628 kcal |
| Net Carbs ⓘ Net Carbs = Total Carbohydrates – Fiber – Sugar Alcohols | 7 grams |
| Default serving size ⓘ Serving sizes are mostly taken from FDA's Reference Amounts Customarily Consumed (RACCs) | 1 oz (21 whole kernels) (28.35 grams) |
| Acidity (Based on PRAL) ⓘ PRAL (Potential renal acid load) is calculated using a formula. On the PRAL scale the higher the positive value, the more is the acidifying effect on the body. The lower the negative value, the higher the alkalinity of the food. 0 is neutral. | -1.9 (alkaline) |
| Oxalates ⓘ https://www.sciencedirect.com/science/article/abs/pii/S0889157513000902 | 194 mg |
Hazelnut calories (kcal)
| Serving Size | Calories | Weight |
|---|---|---|
| Calories in 100 grams | 628 | |
| Calories in 1 cup, chopped | 722 | 115 g |
| Calories in 1 cup, ground | 471 | 75 g |
| Calories in 1 cup, whole | 848 | 135 g |
| Calories in 10 nuts | 88 | 14 g |
Hazelnut Glycemic index (GI)
Mineral coverage chart
Mineral chart - relative view
Vitamin coverage chart
Vitamin chart - relative view
Macronutrients chart
Protein quality breakdown
Fat type information
Carbohydrate type breakdown
Fiber content ratio for Hazelnut
All nutrients for Hazelnut per selected serving size (100 g)
| Nutrient | Value | DV% | In TOP % of foods | Comparison |
| Calories | 628kcal | 31% | 2% |
13.4 times more than Orange
|
| Protein | 15g | 36% | 34% |
5.3 times more than Broccoli
|
| Fats | 61g | 93% | 2% |
1.8 times more than Cheese
|
| Vitamin C | 6.3mg | 7% | 28% |
8.4 times less than Lemon
|
| Net carbs | 7g | N/A | 52% |
7.7 times less than Chocolate
|
| Carbs | 17g | 6% | 39% |
1.7 times less than Rice
|
| Cholesterol | 0mg | 0% | 100% |
N/A
|
| Vitamin D | 0µg | 0% | 100% |
N/A
|
| Magnesium | 163mg | 39% | 12% |
1.2 times more than Almond
|
| Calcium | 114mg | 11% | 20% |
1.1 times less than Milk
|
| Potassium | 680mg | 20% | 9% |
4.6 times more than Cucumber
|
| Iron | 4.7mg | 59% | 11% |
1.8 times more than Beef broiled
|
| Sugar | 4.3g | N/A | 50% |
2.1 times less than Coca-Cola
|
| Fiber | 9.7g | 39% | 11% |
4 times more than Orange
|
| Copper | 1.7mg | 192% | 15% |
12.1 times more than Shiitake
|
| Zinc | 2.5mg | 22% | 35% |
2.6 times less than Beef broiled
|
| Starch | 0.48g | 0% | 96% |
31.9 times less than Potato
|
| Phosphorus | 290mg | 41% | 17% |
1.6 times more than Chicken meat
|
| Sodium | 0mg | 0% | 100% |
N/A
|
| Vitamin A | 20IU | 0% | 58% |
835.3 times less than Carrot
|
| Vitamin A RAE | 1µg | 0% | 72% | |
| Vitamin E | 15mg | 100% | 34% |
10.3 times more than Kiwifruit
|
| Manganese | 6.2mg | 268% | 25% | |
| Selenium | 2.4µg | 4% | 75% | |
| Vitamin B1 | 0.64mg | 54% | 14% |
2.4 times more than Pea raw
|
| Vitamin B2 | 0.11mg | 9% | 65% |
1.2 times less than Avocado
|
| Vitamin B3 | 1.8mg | 11% | 60% |
5.3 times less than Turkey meat
|
| Vitamin B5 | 0.92mg | 18% | 37% |
1.2 times less than Sunflower seed
|
| Vitamin B6 | 0.56mg | 43% | 22% |
4.7 times more than Oat
|
| Vitamin B12 | 0µg | 0% | 100% |
N/A
|
| Vitamin K | 14µg | 12% | 48% |
7.2 times less than Broccoli
|
| Folate | 113µg | 28% | 22% |
1.9 times more than Brussels sprout
|
| Saturated Fat | 4.5g | 22% | 27% |
1.3 times less than Beef broiled
|
| Choline | 46mg | 8% | 66% | |
| Monounsaturated Fat | 46g | N/A | 8% |
4.7 times more than Avocado
|
| Polyunsaturated fat | 7.9g | N/A | 13% |
6 times less than Walnut
|
| Tryptophan | 0.19mg | 0% | 66% |
1.6 times less than Chicken meat
|
| Threonine | 0.5mg | 0% | 73% |
1.4 times less than Beef broiled
|
| Isoleucine | 0.55mg | 0% | 73% |
1.7 times less than Salmon raw
|
| Leucine | 1.1mg | 0% | 72% |
2.3 times less than Tuna Bluefin
|
| Lysine | 0.42mg | 0% | 78% |
1.1 times less than Tofu
|
| Methionine | 0.22mg | 0% | 74% |
2.3 times more than Quinoa
|
| Phenylalanine | 0.66mg | 0% | 70% |
Equal to Egg
|
| Valine | 0.7mg | 0% | 71% |
2.9 times less than Soybean raw
|
| Histidine | 0.43mg | 0% | 70% |
1.7 times less than Turkey meat
|
| Fructose | 0.07g | 0% | 93% |
84.3 times less than Apple
|
| Omega-3 - EPA | 0g | N/A | 100% |
N/A
|
| Omega-3 - DHA | 0g | N/A | 100% |
N/A
|
| Omega-3 - DPA | 0g | N/A | 100% |
N/A
|
| Omega-6 - Eicosadienoic acid | 0g | N/A | 100% |
Check out similar food or compare with current
NUTRITION FACTS LABEL
Serving Size ______________
Health checks
Hazelnut nutrition infographic
References
All the values for which the sources are not specified explicitly are taken from FDA’s Food Central. The exact link to the food presented on this page can be found below.