Pumpkin seeds nutrition: calories, carbs, GI, protein, fiber, fats
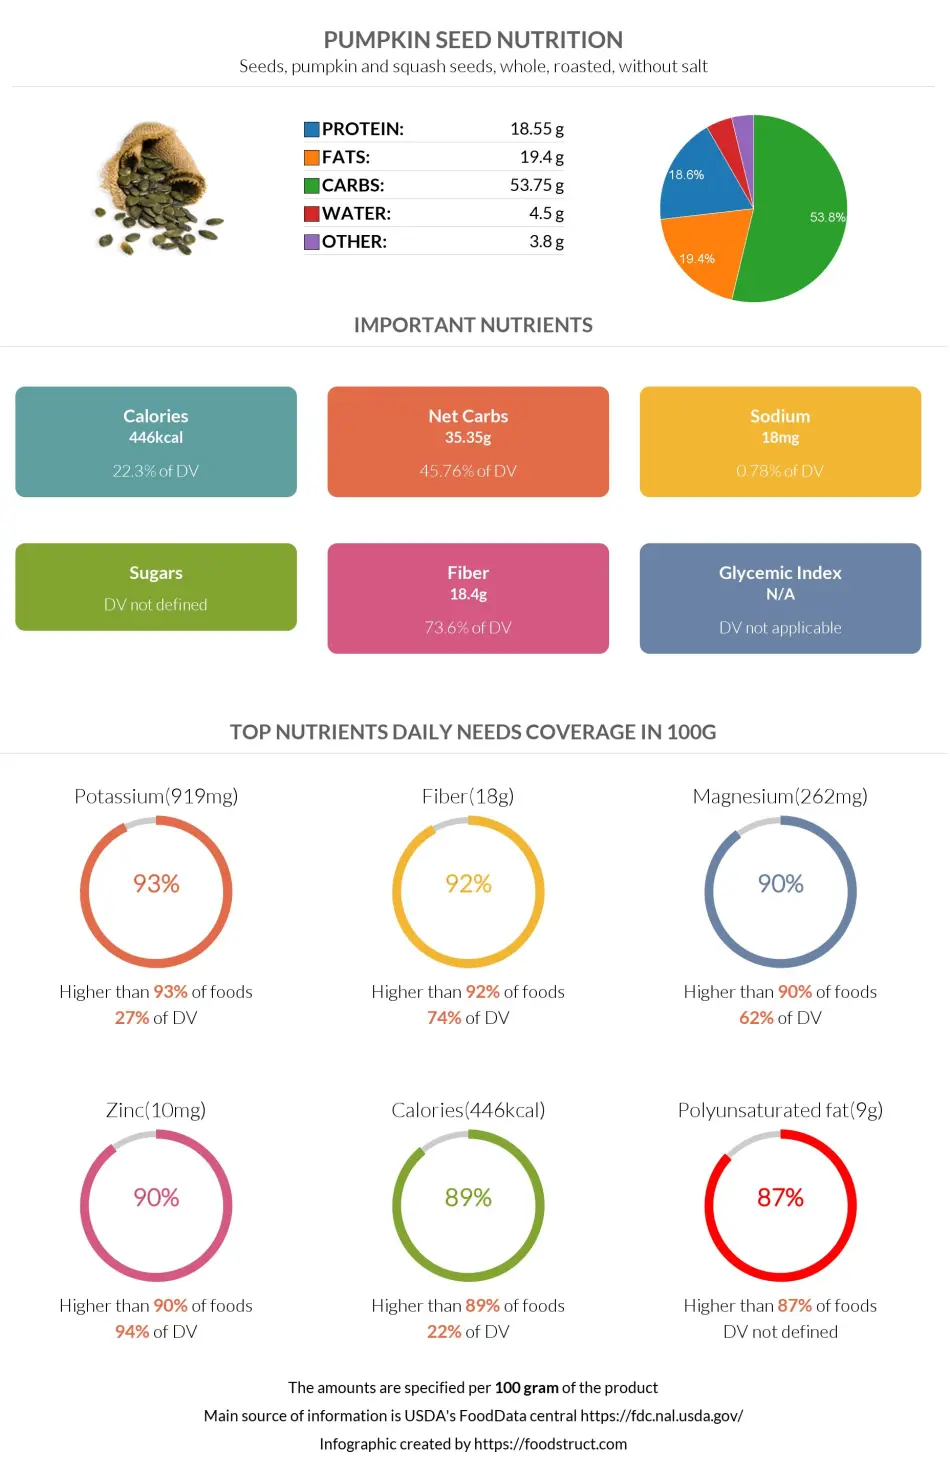
Seeds, pumpkin and squash seeds, whole, roasted, without salt
*all the values are displayed for the amount of 100 grams
Top nutrition facts for Pumpkin seeds
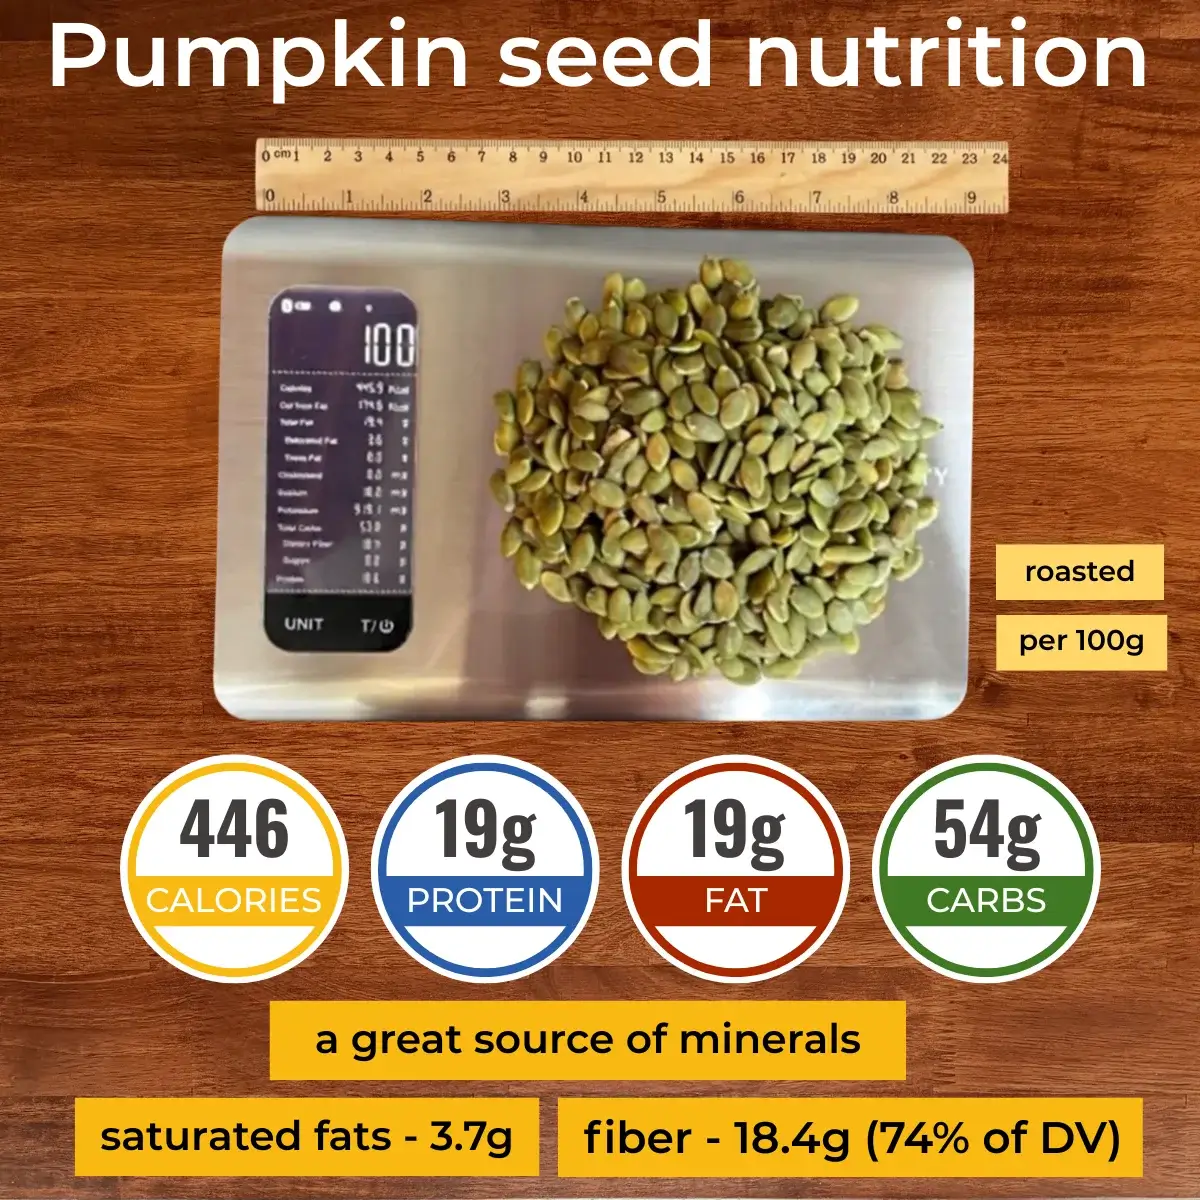
| Calories ⓘ Calories for selected serving | 446 kcal |
| Net carbs ⓘ Net Carbs = Total Carbohydrates – Fiber – Sugar Alcohols | 35 g |
| Magnesium | 262 mg |
| Fiber | 18.4 g |
| Default serving size ⓘ Serving sizes are mostly taken from FDA's Reference Amounts Customarily Consumed (RACCs) | 1 oz (85 seeds) (28.35 g) |
| Unsaturated / Saturated Fat ratio ⓘ (monounsaturated + polyunsaturated) / saturated, ≥2 broadly recommended by major guidelines for heart health | 4.1 |
Medically reviewed by Ani Harutyunyan

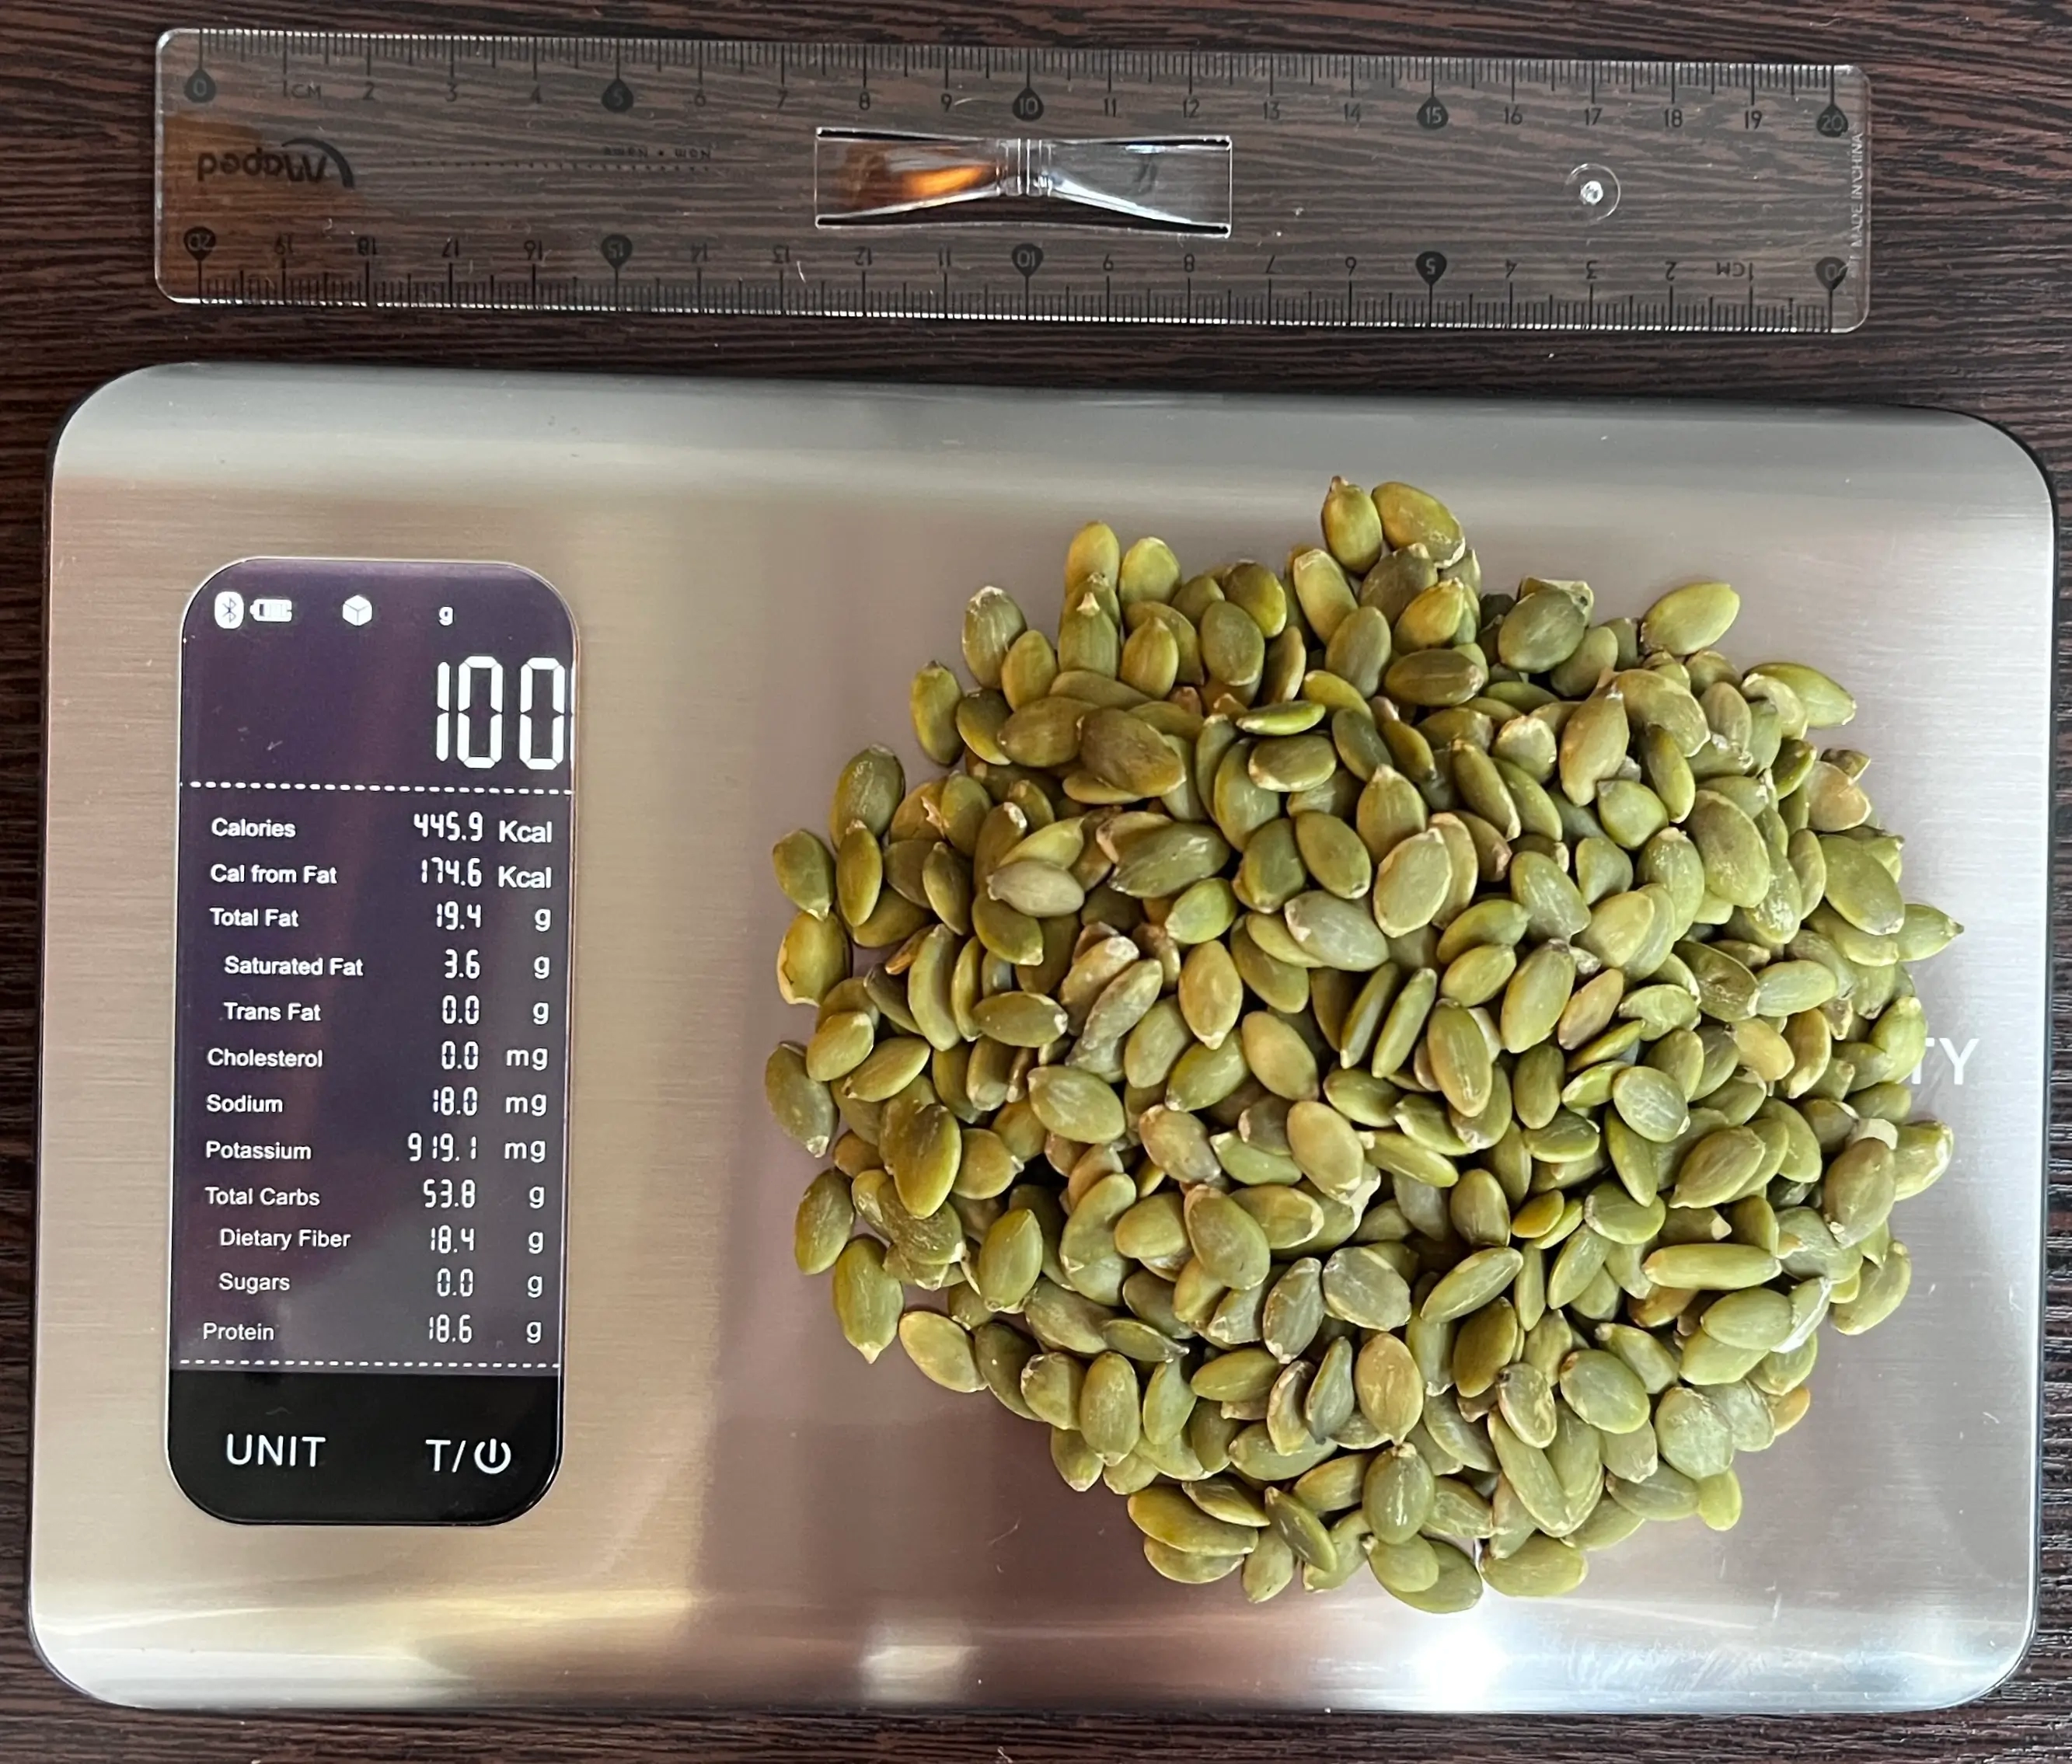
What Do 446 Calories or 100 Grams of Pumpkin Seeds Look Like?
The picture below shows what 446 calories or 100 grams of whole, roasted pumpkin seeds (without salt) look like, giving a visual reference for their weight and energy content. A typical serving size is about 28.35 g (1 ounce), which provides roughly 126 calories. The calories may vary slightly depending on the roasting method and seed size.

Education: General Medicine at YSMU
Last updated: September 03, 2025
Medically reviewed by Ani Harutyunyan
Pumpkin seeds calories (kcal)
| Calories for different serving sizes of pumpkin seeds | Calories | Weight |
|---|---|---|
| Calories in 100 grams | 446 | |
| Calories in 1 cup | 285 | 64 g |
Extra Nutrition facts for Pumpkin seeds
| Protein per 100 calories ⓘ Shows how many grams of protein you get from 100 calories of this food, calculated as (protein in g ÷ calories) × 100. | 4.2 g |
| Calories per 10 g protein ⓘ Shows how many calories you need to eat from this food to get 10 g of protein, calculated as (calories ÷ protein in g) × 10. | 240 kcal |
| Weight per 100 calories ⓘ Shows how many grams of this food equal 100 kcal—higher grams mean a larger portion for the same calories. | 22 g |
| Campesterol ⓘ https://fdc.nal.usda.gov/food-details/170182/nutrients | 5 mg ⓘ https://www.mdpi.com/2304-8158/14/3/354 |
| Beta-sitosterol ⓘ Beta-sitosterol is a naturally occurring plant sterol (phytosterol) that is structurally similar to cholesterol. It is found in various plant-based foods and is commonly used in supplements, primarily for lowering cholesterol levels and improving symptoms of an enlarged prostate (BPH). | 32 mg ⓘ https://www.mdpi.com/2304-8158/14/3/354 |
| Acidity (Based on PRAL) ⓘ PRAL (Potential renal acid load) is calculated using a formula. On the PRAL scale the higher the positive value, the more is the acidifying effect on the body. The lower the negative value, the higher the alkalinity of the food. 0 is neutral. | -14.3 (alkaline) |
| Oxalates | 0 mg ⓘ https://www.sciencedirect.com/science/article/abs/pii/S0889157513000902 |
| Lauric acid | 1 mg ⓘ https://www.sciencedirect.com/science/article/pii/S2468227620303136 |
| Beta-carotenoid | 9 mcg ⓘ https://www.researchgate.net/publication/336797715 |
| Lutein-zeaxanthin | 74 mcg ⓘ https://www.researchgate.net/publication/336797715 |
| Total sterols | 547 mg ⓘ https://www.mdpi.com/2304-8158/14/3/354 |
| Squalene | 84 mg ⓘ https://iadns.onlinelibrary.wiley.com/doi/10.1002/fft2.117 |
| Processing score ⓘ The processing score is a calculated value that looks at both how industrially made it is (NOVA) and how healthy/unprocessed the ingredients are (SIGA), then combines them into one score from 1 (least processed) to 4 (most processed). | 1 - Unprocessed ⓘ NOVA score = 1, SIGA score = A0 |
Pumpkin seeds Glycemic index (GI)
Source:
Check out our full article on Pumpkin seeds glycemic index
Check out our Glycemic index chart page for the full list.
Mineral coverage chart
Mineral chart - relative view
Vitamin coverage chart
Vitamin A:
9µg of 900µg
1%
Vitamin E:
0mg of 15mg
0%
Vitamin D:
0µg of 20µg
0%
Vitamin C:
0.9mg of 90mg
1%
Vitamin B1:
0.1mg of 1mg
8.5%
Vitamin B2:
0.16mg of 1mg
12%
Vitamin B3:
0.86mg of 16mg
5.4%
Vitamin B5:
0.17mg of 5mg
3.4%
Vitamin B6:
0.11mg of 1mg
8.5%
Folate:
27µg of 400µg
6.8%
Vitamin B12:
0µg of 2µg
0%
Vitamin K:
0µg of 120µg
0%
Vitamin chart - relative view
Macronutrients chart
Protein:
Daily Value: 37%
18.6 g of 50 g
18.6 g (37% of DV )
Fats:
Daily Value: 30%
19.4 g of 65 g
19.4 g (30% of DV )
Carbs:
Daily Value: 18%
53.8 g of 300 g
53.8 g (18% of DV )
Water:
Daily Value: 0%
4.5 g of 2,000 g
4.5 g (0% of DV )
Other:
3.8 g
3.8 g
Protein quality breakdown
Tryptophan:
978mg of 280mg
349%
Threonine:
2049mg of 1,050mg
195%
Isoleucine:
2868mg of 1,400mg
205%
Leucine:
4716mg of 2,730mg
173%
Lysine:
4158mg of 2,100mg
198%
Methionine:
1251mg of 1,050mg
119%
Phenylalanine:
2772mg of 1,750mg
158%
Valine:
4473mg of 1,820mg
246%
Histidine:
1545mg of 700mg
221%
Fat type information
Saturated fat:
3.7 g
Monounsaturated fat:
6 g
Polyunsaturated fat:
8.8 g
Fiber content ratio for Pumpkin seeds
Sugar:
0 g
Fiber:
18 g
Other:
35 g
All nutrients for Pumpkin seeds per 100g
| Nutrient | Value | DV% | In TOP % of foods | Comparison |
| Vitamin A | 3µg | 0% | 45% | |
| Calories | 446kcal | 22% | 11% |
9.5 times more than Orange
|
| Protein per 100 calories | 4.2g | N/A | 51% | |
| Calories per 10 g protein | 240kcal | N/A | 46% | |
| Protein | 19g | 44% | 28% |
6.6 times more than Broccoli
|
| Weight per 100 calories | 22g | N/A | 89% | |
| Fats | 19g | 30% | 16% |
1.7 times less than Cheese
|
| Unsaturated / Saturated Fat ratio | 4.1 | N/A | 17% | |
| Vitamin C | 0.3mg | 0% | 41% |
176.7 times less than Lemon
|
| Carbs | 54g | 18% | 19% |
1.9 times more than Rice
|
| Net carbs | 35g | N/A | 24% |
1.5 times less than Chocolate
|
| Cholesterol | 0mg | 0% | 100% |
N/A
|
| Vitamin D* | 0 IU | 0% | 100% |
N/A
|
| Vitamin D | 0µg | 0% | 100% |
N/A
|
| Magnesium | 262mg | 62% | 2% |
1.9 times more than Almonds
|
| Calcium | 55mg | 6% | 29% |
2.3 times less than Milk
|
| Potassium | 919mg | 27% | 3% |
6.3 times more than Cucumber
|
| Iron | 3.3mg | 41% | 17% |
1.3 times more than Beef broiled
|
| Fiber | 18g | 74% | 2% |
7.7 times more than Orange
|
| Copper | 0.69mg | 77% | 4% |
4.9 times more than Shiitake
|
| Zinc | 10mg | 94% | 2% |
1.6 times more than Beef broiled
|
| Phosphorus | 92mg | 13% | 60% |
2 times less than Chicken meat
|
| Sodium | 18mg | 1% | 81% |
27.2 times less than White bread
|
| Manganese | 0.5mg | 22% | 14% | |
| Vitamin B1 | 0.03mg | 3% | 73% |
7.8 times less than Pea raw
|
| Vitamin B2 | 0.05mg | 4% | 74% |
2.5 times less than Avocado
|
| Vitamin B3 | 0.29mg | 2% | 78% |
33.5 times less than Turkey meat
|
| Vitamin B5 | 0.06mg | 1% | 68% |
20.2 times less than Sunflower seeds
|
| Vitamin B6 | 0.04mg | 3% | 75% |
3.2 times less than Oats
|
| Vitamin B12 | 0µg | 0% | 100% |
N/A
|
| Folate | 9µg | 2% | 51% |
6.8 times less than Brussels sprouts
|
| Saturated fat | 3.7g | 18% | 29% |
1.6 times less than Beef broiled
|
| Monounsaturated fat | 6g | N/A | 19% |
1.6 times less than Avocado
|
| Polyunsaturated fat | 8.8g | N/A | 6% |
5.3 times less than Walnut
|
| Tryptophan | 0.33mg | 0% | 6% |
1.1 times more than Chicken meat
|
| Threonine | 0.68mg | 0% | 28% |
1.1 times less than Beef broiled
|
| Isoleucine | 0.96mg | 0% | 20% |
Equal to Salmon raw
|
| Leucine | 1.6mg | 0% | 23% |
1.5 times less than Tuna Bluefin
|
| Lysine | 1.4mg | 0% | 27% |
3.1 times more than Tofu
|
| Methionine | 0.42mg | 0% | 28% |
4.3 times more than Quinoa
|
| Phenylalanine | 0.92mg | 0% | 16% |
1.4 times more than Egg
|
| Valine | 1.5mg | 0% | 5% |
1.4 times less than Soybean raw
|
| Histidine | 0.52mg | 0% | 27% |
1.5 times less than Turkey meat
|
Check out similar food or compare with current
NUTRITION FACTS LABEL
Nutrition Facts
___servings per container
Serving Size ______________
Serving Size ______________
Amount Per 100g
Calories 446
% Daily Value*
30%
Total Fat
19g
17%
Saturated Fat 3.7g
0
Trans Fat
0g
0
Cholesterol 0mg
0.78%
Sodium 18mg
18%
Total Carbohydrate
54g
74%
Dietary Fiber
18g
Total Sugars 0g
Includes ? g Added Sugars
Protein
19g
Vitamin D
0mcg
0
Calcium
55mg
5.5%
Iron
3.3mg
41%
Potassium
919mg
27%
*
The % Daily Value (DV) tells you how much a nutrient in a serving of food contributes to a daily diet. 2,000 calories a day is used for general nutrition advice.
Health checks
ⓘ
Dietary cholesterol is not associated with an increased risk of coronary heart disease in healthy individuals. However, dietary cholesterol is common in foods that are high in harmful saturated fats.
Source
Low in Cholesterol
ⓘ
Trans fat consumption increases the risk of cardiovascular disease and mortality by negatively affecting blood lipid levels.
Source
No Trans Fats
ⓘ
Saturated fat intake can raise total cholesterol and LDL (low-density lipoprotein) levels, leading to an increased risk of atherosclerosis. Dietary guidelines recommend limiting saturated fats to under 10% of calories a day.
Source
Low in Saturated Fats
ⓘ
While the consumption of moderate amounts of added sugars is not detrimental to health, an excessive intake can increase the risk of obesity, and therefore, diabetes.
Source
Low in Sugars
Pumpkin seeds nutrition infographic
Infographic link
References
All the values for which the sources are not specified explicitly are taken from FDA’s Food Central. The exact link to the food presented on this page can be found below.