Carp vs. Catfish — Health Impact and Nutrition Comparison


Summary
Catfish is usually easier to cook, has a milder taste, and a firmer texture, while carp has many small bones, a stronger taste, and a softer texture.
Carp is somewhat denser in nutrients, being higher in calories and protein. While carp and catfish contain the same amount of fats, carp is higher in polyunsaturated fats, such as omega-3 fatty acids, and cholesterol, and catfish is higher in saturated and monounsaturated fats.
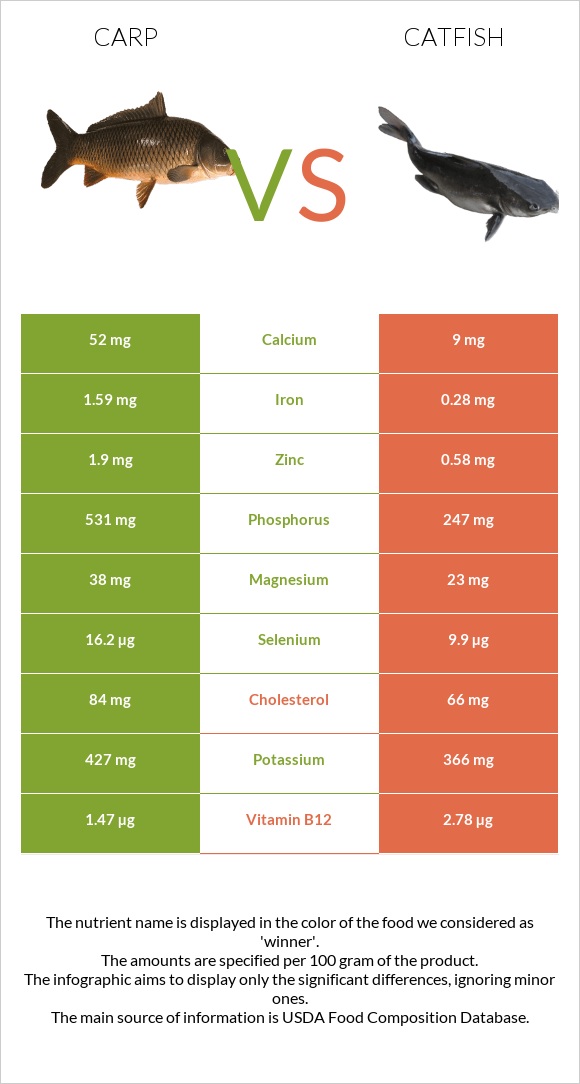
Carp provides 10 times more vitamin A, 6 times more vitamin B1, calcium, and iron, and 3 times more zinc and manganese. Carp is richer in nearly all minerals.
Catfish, however, is a better source of vitamin B12. Catfish is also lower in mercury compared to carp.
Introduction
Catfish and carp are two popular types of freshwater white fish in Western cuisine. In this article, we will focus on their differences to help you make an educated choice between the two.
Taste and Use
Catfish tends to have a milder and softer taste, while carp has a somewhat fishier flavor. This is especially true if we compare farm-raised catfish to wild-caught carp. Despite the similar fat content, carp also tends to have a slightly softer and oilier texture compared to the firm and flaky texture of catfish.
Catfish is usually easy to cook, whereas carp requires deboning, which can be time-consuming due to its small bones.
Catfish is more popular in North American cuisine, whereas carp is a lot more widely used in Eastern Europe and Asia.
Nutrition
The nutritional infographics below are presented for 100g servings of carp and farmed channel catfish cooked by dry heat. If you want to learn about the nutritional value of these fish prepared in different methods or various serving sizes, you can select these options.
The average serving sizes per person for both of these fish are 3 ounces or 85g.
Macronutrients and Calories
Carp tends to be overall denser in nutrients, being composed of 30% nutrients and 70% water, while catfish is made up of 25% nutrients and 75% water.
Macronutrient Comparison
Contains
more
ProteinProtein
+24%
Contains
more
OtherOther
+∞%
Calories
Carp and catfish are similar in calories, providing 162 and 144 calories, respectively. Thus, carp is slightly higher in calories compared to catfish.
Protein
While both of these fish are good sources of protein, carp is significantly richer in protein than catfish, by 4.4g per 100g serving to be exact.
A 100g serving of carp and catfish contains 22.9g and 18.4g of protein, respectively.
Carp and catfish are high in all the essential amino acids, but carp is naturally richer in these.
Fats
Being white fish, carp and catfish are not very high in fats, containing nearly the same amount, 7g per 100g serving.
That being said, their fat compositions are different. Carp is higher in polyunsaturated fats, such as omega-3 fatty acids, while catfish contains more saturated and monounsaturated fats. Carp is also higher in cholesterol.
Fat Type Comparison
Contains
less
Sat. FatSaturated fat
-12.5%
Contains
more
Poly. FatPolyunsaturated fat
+35.5%
Carbohydrates
Like most fish, both catfish and carp contain no carbohydrates.
Vitamins
Carp has a somewhat more favorable vitamin profile than catfish. It is 10 times richer in vitamin A and 6 times richer in vitamin B1. Carp provides more vitamin B6 and folate or vitamin B9, and it is a source of vitamin C, which catfish lacks entirely.
On the other hand, catfish is a better source of vitamins B12, B2, and B3.
Vitamin Comparison
Contains
more
Vitamin CVitamin C
+∞%
Contains
more
Vitamin AVitamin A
+900%
Contains
more
Vitamin B1Vitamin B1
+483.3%
Contains
more
Vitamin B6Vitamin B6
+23.7%
Contains
more
FolateFolate
+41.7%
Contains
more
Vitamin B2Vitamin B2
+42.9%
Contains
more
Vitamin B3Vitamin B3
+21.3%
Contains
more
Vitamin B12Vitamin B12
+89.1%
Minerals
Carp wins in the mineral category hands down, being richer in nearly all minerals. In particular, carp contains 6 times more calcium and iron, 3 times more zinc and manganese, approximately twice as much phosphorus and copper, and is overall higher in magnesium, selenium, and potassium.
Carp also tends to be naturally a little saltier.
Mineral Comparison
Contains
more
MagnesiumMagnesium
+65.2%
Contains
more
CalciumCalcium
+477.8%
Contains
more
PotassiumPotassium
+16.7%
Contains
more
IronIron
+467.9%
Contains
more
CopperCopper
+87.2%
Contains
more
ZincZinc
+227.6%
Contains
more
PhosphorusPhosphorus
+115%
Contains
less
SodiumSodium
-47.1%
Contains
more
ManganeseManganese
+177.8%
Contains
more
SeleniumSelenium
+63.6%
Glycemic Index
The glycemic index value of foods with no carbohydrates, such as catfish and carp, is considered to be 0.
Insulin Index
The insulin index is useful for foods with no carbohydrates, as it helps us understand how the given food affects our insulin levels. The insulin index value of carp and catfish can be considered 59, which is the same as that of white fish (1).
Health Impact
White fish, such as carp and catfish, are generally considered healthy dietary choices. In this section, we will look at the science behind this claim.
Cardiovascular Health
One high-quality systematic review found that consuming non-fried fish is associated with a decreased overall risk of cardiovascular disease and heart attack. In contrast, the consumption of fried fish has been associated with an increased risk (2).
One study found that consuming carp with an elevated omega-3 fatty acid content leads to improved blood lipid levels in individuals who have undergone heart surgery (3).
Another study found that consuming two portions of fish per week can reduce the risk of cardiovascular disease outcomes by 10%, while eating a full portion of fish daily can reduce this risk by approximately 30% (4).
Diabetes
Catfish and carp have very low glycemic index and medium insulin index values.
Research has found that both white and fatty fish intake are inversely associated with diabetes risk. However, this association was not significant after adjusting for obesity factors (5).
Another study found that fatty fish was associated with a lower risk of type 2 diabetes, but not white fish, such as carp and catfish (6).
Mercury Content
According to the FDA, catfish is lower in mercury than carp. Catfish falls under the category of the “Best Choices” of fish to have in regards to mercury content, while carp falls in the “Good Choices” category (7).
During pregnancy and lactation, it is recommended to consume 2 to 3 four-ounce portions of catfish per week, taking into consideration the mercury content. It is advised to serve carp only once per week.
Sources.
- https://www.sciencedirect.com/science/article/pii/S2405457724001633
- https://pubmed.ncbi.nlm.nih.gov/33444594/
- https://www.researchgate.net/publication/51816076
- https://pubmed.ncbi.nlm.nih.gov/37960192/
- https://pmc.ncbi.nlm.nih.gov/articles/PMC2752921
- https://diabetesjournals.org/care/article/44/3/672/138757/
- https://www.fda.gov/food/consumers/advice-about-eating-fish#choice

Infographic
All nutrients comparison - raw data values
| Nutrient | |
|
DV% diff. |
| Vitamin B12 | 1.47µg | 2.78µg | 55% |
| Phosphorus | 531mg | 247mg | 41% |
| Iron | 1.59mg | 0.28mg | 16% |
| Choline | 78.7mg | 14% | |
| Zinc | 1.9mg | 0.58mg | 12% |
| Selenium | 16.2µg | 9.9µg | 11% |
| Vitamin B1 | 0.14mg | 0.024mg | 10% |
| Protein | 22.86g | 18.44g | 9% |
| Cholesterol | 84mg | 66mg | 6% |
| Vitamin E | 0.97mg | 6% | |
| Magnesium | 38mg | 23mg | 4% |
| Calcium | 52mg | 9mg | 4% |
| Copper | 0.073mg | 0.039mg | 4% |
| Vitamin B3 | 2.1mg | 2.548mg | 3% |
| Vitamin B6 | 0.219mg | 0.177mg | 3% |
| Polyunsaturated fat | 1.835g | 1.354g | 3% |
| Vitamin C | 1.6mg | 0mg | 2% |
| Vitamin D | 0.3µg | 2% | |
| Potassium | 427mg | 366mg | 2% |
| Sodium | 63mg | 119mg | 2% |
| Vitamin B2 | 0.07mg | 0.1mg | 2% |
| Vitamin K | 2.5µg | 2% | |
| Calories | 162kcal | 144kcal | 1% |
| Vitamin D* | 10 IU | 1% | |
| Vitamin A | 10µg | 1µg | 1% |
| Manganese | 0.05mg | 0.018mg | 1% |
| Vitamin B5 | 0.87mg | 0.811mg | 1% |
| Folate | 17µg | 12µg | 1% |
| Saturated fat | 1.388g | 1.586g | 1% |
| Protein per 100 calories | 14g | 13g | N/A |
| Calories per 10 g protein | 71kcal | 78kcal | N/A |
| Weight per 100 calories | 62g | 69g | N/A |
| Fats | 7.17g | 7.19g | 0% |
| Unsaturated / Saturated Fat ratio | 3.5 | 2.8 | N/A |
| Trans fat | 0.063g | N/A | |
| Monounsaturated fat | 2.985g | 3.115g | 0% |
| Tryptophan | 0.256mg | 0.22mg | 0% |
| Threonine | 1.002mg | 0.833mg | 0% |
| Isoleucine | 1.054mg | 0.82mg | 0% |
| Leucine | 1.858mg | 1.396mg | 0% |
| Lysine | 2.1mg | 1.677mg | 0% |
| Methionine | 0.677mg | 0.539mg | 0% |
| Phenylalanine | 0.893mg | 0.735mg | 0% |
| Valine | 1.178mg | 0.894mg | 0% |
| Histidine | 0.673mg | 0.404mg | 0% |
| Omega-3 - EPA | 0.305g | 0.02g | N/A |
| Omega-3 - DHA | 0.146g | 0.069g | N/A |
| Omega-3 - DPA | 0.105g | 0.018g | N/A |
| Omega-6 - Eicosadienoic acid | 0.049g | N/A |
People also compare


References
All the values for which the sources are not specified explicitly are taken from FDA’s Food Central. The exact link to the food presented on this page can be found below.
- Carp - https://fdc.nal.usda.gov/fdc-app.html#/food-details/174185/nutrients
- Catfish - https://fdc.nal.usda.gov/fdc-app.html#/food-details/175166/nutrients
All the Daily Values are presented for males aged 31-50, for 2000-calorie diets.