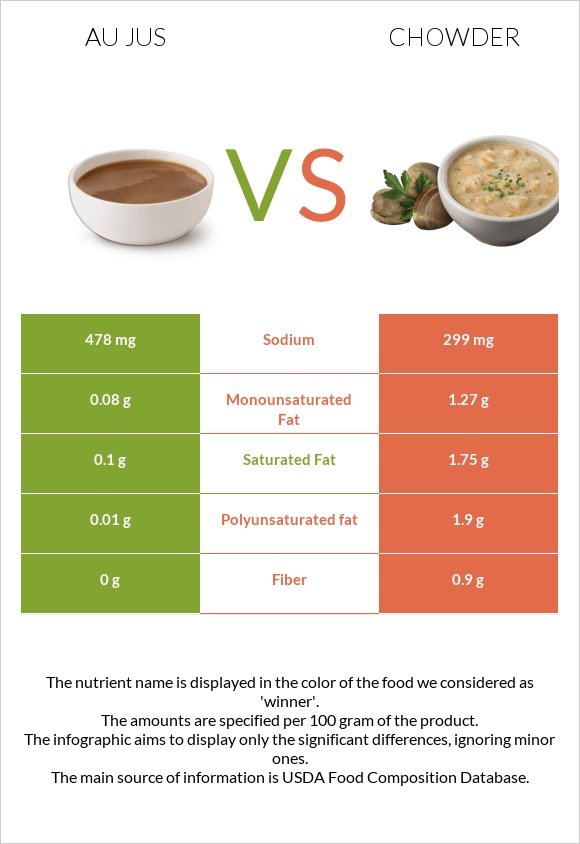
How are au jus and chowder different? Chowder has more vitamin A, monounsaturated fat, and polyunsaturated fat than au jus. Daily need coverage for vitamin A for chowder is 23% higher. Au jus contains 2 times more sodium than chowder. While au jus contains 478mg of sodium, chowder contains only 299mg. Gravy, au jus, canned and Soup, chicken corn chowder, chunky, ready-to-serve, single brand are the varieties used in this article.
Infographic
Mineral Comparison
Mineral comparison score is based on the number of minerals by which one or the other food is richer. The "coverage" charts below show how much of the daily needs can be covered by 300 grams of the food.
9
100 g
300 g
0.25 cup - 59g 1 can - 298g
Magnesium
Magnesium
Calcium
Calcium
Potassium
Potassium
Iron
Iron
Copper
Copper
Zinc
Zinc
Phosphorus
Phosphorus
Sodium
Sodium
Manganese
Manganese
Selenium
Selenium
1.4%
1.2%
7.1%
23%
33%
27%
13%
62%
26%
2.2%
1
100 g
300 g
1 serving - 240g 1 package yields - 539g
Magnesium
Magnesium
Calcium
Calcium
Potassium
Potassium
Iron
Iron
Copper
Copper
Zinc
Zinc
Phosphorus
Phosphorus
Sodium
Sodium
Manganese
Manganese
Selenium
Selenium
0%
0%
0%
0%
0%
0%
0%
39%
0%
0%
Vitamin Comparison
Vitamin comparison score is based on the number of vitamins by which one or the other food is richer. The "coverage" charts below show how much of the daily needs can be covered by 300 grams of the food.
8
100 g
300 g
0.25 cup - 59g 1 can - 298g
Vitamin C
Vit. C
Vitamin D
Vit. D
Vitamin A
Vit. A
Vitamin E
Vit. E
Vitamin B1
Vit. B1
Vitamin B2
Vit. B2
Vitamin B3
Vit. B3
Vitamin B5
Vit. B5
Vitamin B6
Vit. B6
Vitamin B12
Vit. B12
Vitamin K
Vit. K
Folate
Folate
3.3%
0%
0%
0%
5%
14%
17%
1.2%
2.3%
13%
0%
1.5%
1
100 g
300 g
1 serving - 240g 1 package yields - 539g
Vitamin C
Vit. C
Vitamin D
Vit. D
Vitamin A
Vit. A
Vitamin E
Vit. E
Vitamin B1
Vit. B1
Vitamin B2
Vit. B2
Vitamin B3
Vit. B3
Vitamin B5
Vit. B5
Vitamin B6
Vit. B6
Vitamin B12
Vit. B12
Vitamin K
Vit. K
Folate
Folate
0%
0%
19%
0%
0%
0%
0%
0%
0%
0%
0%
0%
All nutrients comparison - raw data values
Macronutrient Comparison
Macronutrient breakdown side-by-side comparison
2
3%
95%
Protein:
1.2 g
Fats:
0.2 g
Carbs:
2.5 g
Water:
94.5 g
Other:
1.6 g
3
3%
6%
8%
82%
Protein:
3.1 g
Fats:
6.3 g
Carbs:
7.5 g
Water:
82.1 g
Other:
1 g
Contains
more
Water Water
+15.1%
Contains
more
Other Other
+60%
Contains
more
Protein Protein
+158.3%
Contains
more
Fats Fats
+3050%
Contains
more
Carbs Carbs
+200%
Fat Type Comparison
Fat type breakdown side-by-side comparison
1
53%
42%
5%
Saturated fat:
Sat. Fat
0.1 g
Monounsaturated fat:
Mono. Fat
0.08 g
Polyunsaturated fat:
Poly. Fat
0.01 g
2
36%
26%
39%
Saturated fat:
Sat. Fat
1.75 g
Monounsaturated fat:
Mono. Fat
1.27 g
Polyunsaturated fat:
Poly. Fat
1.9 g
Contains
less
Sat. Fat Saturated fat
-94.3%
Contains
more
Mono. Fat Monounsaturated fat
+1487.5%
Contains
more
Poly. Fat Polyunsaturated fat
+18900%