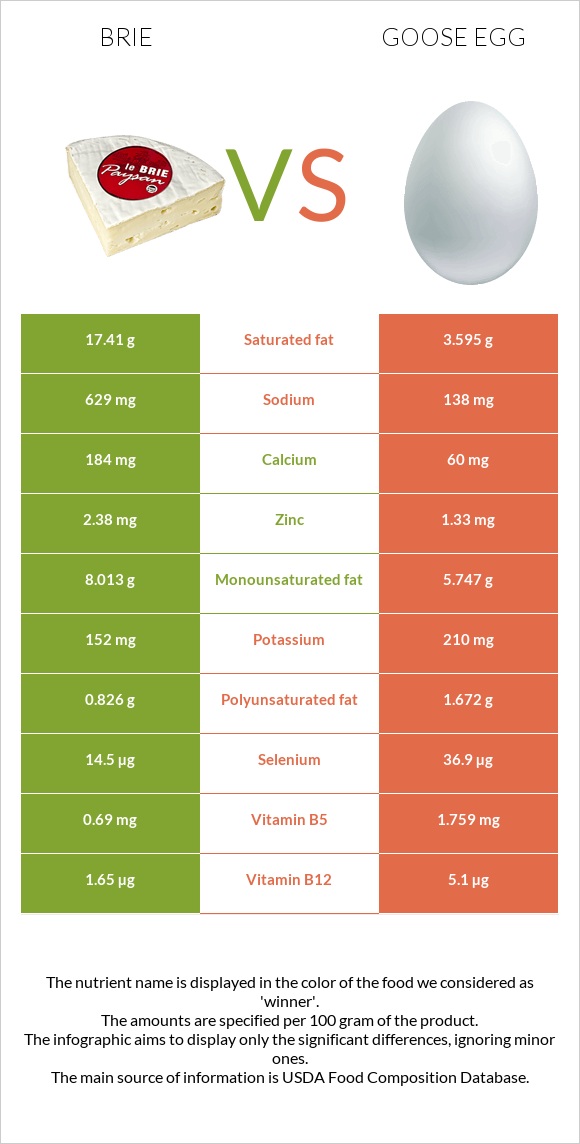
A recap on the differences between brie and goose eggs Brie is higher in calcium and vitamin B2, yet goose eggs are higher in vitamin B12, choline, selenium, iron, and vitamin B5. Goose eggs cover your daily cholesterol needs 251% more than brie. Brie contains 5 times more saturated fat than goose eggs. While brie contains 17.41g of saturated fat, goose eggs contain only 3.595g. Food varieties used in this article are Cheese, brie and Egg, goose, whole, fresh, raw .
Infographic
Mineral Comparison
Mineral comparison score is based on the number of minerals by which one or the other food is richer. The "coverage" charts below show how much of the daily needs can be covered by 300 grams of the food.
3
100 g
300 g
1 cubic inch - 17g 1 oz - 28.35g 1 package (4.5 oz) - 128g 1 cup, sliced - 144g 1 cup, melted - 240g
Magnesium
Magnesium
Calcium
Calcium
Potassium
Potassium
Iron
Iron
Copper
Copper
Zinc
Zinc
Phosphorus
Phosphorus
Sodium
Sodium
Manganese
Manganese
Selenium
Selenium
14%
55%
13%
19%
6.3%
65%
81%
82%
4.4%
79%
7
100 g
300 g
1 egg - 144g
Magnesium
Magnesium
Calcium
Calcium
Potassium
Potassium
Iron
Iron
Copper
Copper
Zinc
Zinc
Phosphorus
Phosphorus
Sodium
Sodium
Manganese
Manganese
Selenium
Selenium
11%
18%
19%
137%
21%
36%
89%
18%
5%
201%
Vitamin Comparison
Vitamin comparison score is based on the number of vitamins by which one or the other food is richer. The "coverage" charts below show how much of the daily needs can be covered by 300 grams of the food.
3
100 g
300 g
1 cubic inch - 17g 1 oz - 28.35g 1 package (4.5 oz) - 128g 1 cup, sliced - 144g 1 cup, melted - 240g
Vitamin C
Vit. C
Vitamin D
Vit. D
Vitamin A
Vit. A
Vitamin E
Vit. E
Vitamin B1
Vit. B1
Vitamin B2
Vit. B2
Vitamin B3
Vit. B3
Vitamin B5
Vit. B5
Vitamin B6
Vit. B6
Vitamin B12
Vit. B12
Vitamin K
Vit. K
Folate
Folate
0%
7.5%
58%
4.8%
18%
120%
7.1%
41%
54%
206%
5.8%
49%
6
100 g
300 g
1 egg - 144g
Vitamin C
Vit. C
Vitamin D
Vit. D
Vitamin A
Vit. A
Vitamin E
Vit. E
Vitamin B1
Vit. B1
Vitamin B2
Vit. B2
Vitamin B3
Vit. B3
Vitamin B5
Vit. B5
Vitamin B6
Vit. B6
Vitamin B12
Vit. B12
Vitamin K
Vit. K
Folate
Folate
0%
26%
62%
26%
37%
88%
3.5%
106%
54%
638%
1%
57%
All nutrients comparison - raw data values
Nutrient
DV% diff.
Cholesterol
100mg
852mg
251%
Vitamin B12
1.65µg
5.1µg
144%
Saturated fat
17.41g
3.595g
63%
Choline
15.4mg
263.4mg
45%
Selenium
14.5µg
36.9µg
41%
Iron
0.5mg
3.64mg
39%
Fats
27.68g
13.27g
22%
Sodium
629mg
138mg
21%
Vitamin B5
0.69mg
1.759mg
21%
Protein
20.75g
13.87g
14%
Calcium
184mg
60mg
12%
Vitamin B2
0.52mg
0.382mg
11%
Zinc
2.38mg
1.33mg
10%
Calories
334kcal
185kcal
7%
Vitamin E
0.24mg
1.29mg
7%
Vitamin D*
20 IU
66 IU
6%
Vitamin D
0.5µg
1.7µg
6%
Vitamin B1
0.07mg
0.147mg
6%
Monounsaturated fat
8.013g
5.747g
6%
Polyunsaturated fat
0.826g
1.672g
6%
Copper
0.019mg
0.062mg
5%
Phosphorus
188mg
208mg
3%
Folate
65µg
76µg
3%
Potassium
152mg
210mg
2%
Vitamin K
2.3µg
0.4µg
2%
Magnesium
20mg
16mg
1%
Vitamin A
174µg
187µg
1%
Vitamin B3
0.38mg
0.189mg
1%
Protein per 100 calories
6.2g
7.5g
N/A
Calories per 10 g protein
161kcal
133kcal
N/A
Weight per 100 calories
30g
54g
N/A
Unsaturated / Saturated Fat ratio
0.51
2.1
N/A
Net carbs
0.45g
1.35g
N/A
Carbs
0.45g
1.35g
0%
Sugar
0.45g
0.94g
N/A
Manganese
0.034mg
0.038mg
0%
Vitamin B6
0.235mg
0.236mg
0%
Tryptophan
0.322mg
0.282mg
0%
Threonine
0.751mg
0.797mg
0%
Isoleucine
1.015mg
0.647mg
0%
Leucine
1.929mg
1.188mg
0%
Lysine
1.851mg
1.03mg
0%
Methionine
0.592mg
0.624mg
0%
Phenylalanine
1.158mg
0.91mg
0%
Valine
1.34mg
0.958mg
0%
Histidine
0.716mg
0.346mg
0%
Macronutrient Comparison
Macronutrient breakdown side-by-side comparison
3
21%
28%
48%
3%
Protein:
20.75 g
Fats:
27.68 g
Carbs:
0.45 g
Water:
48.42 g
Other:
2.7 g
2
14%
13%
70%
Protein:
13.87 g
Fats:
13.27 g
Carbs:
1.35 g
Water:
70.43 g
Other:
1.08 g
Contains
more
Protein Protein
+49.6%
Contains
more
Fats Fats
+108.6%
Contains
more
Other Other
+150%
Contains
more
Carbs Carbs
+200%
Contains
more
Water Water
+45.5%
Fat Type Comparison
Fat type breakdown side-by-side comparison
1
66%
31%
3%
Saturated fat:
Sat. Fat
17.41 g
Monounsaturated fat:
Mono. Fat
8.013 g
Polyunsaturated fat:
Poly. Fat
0.826 g
2
33%
52%
15%
Saturated fat:
Sat. Fat
3.595 g
Monounsaturated fat:
Mono. Fat
5.747 g
Polyunsaturated fat:
Poly. Fat
1.672 g
Contains
more
Mono. Fat Monounsaturated fat
+39.4%
Contains
less
Sat. Fat Saturated fat
-79.4%
Contains
more
Poly. Fat Polyunsaturated fat
+102.4%