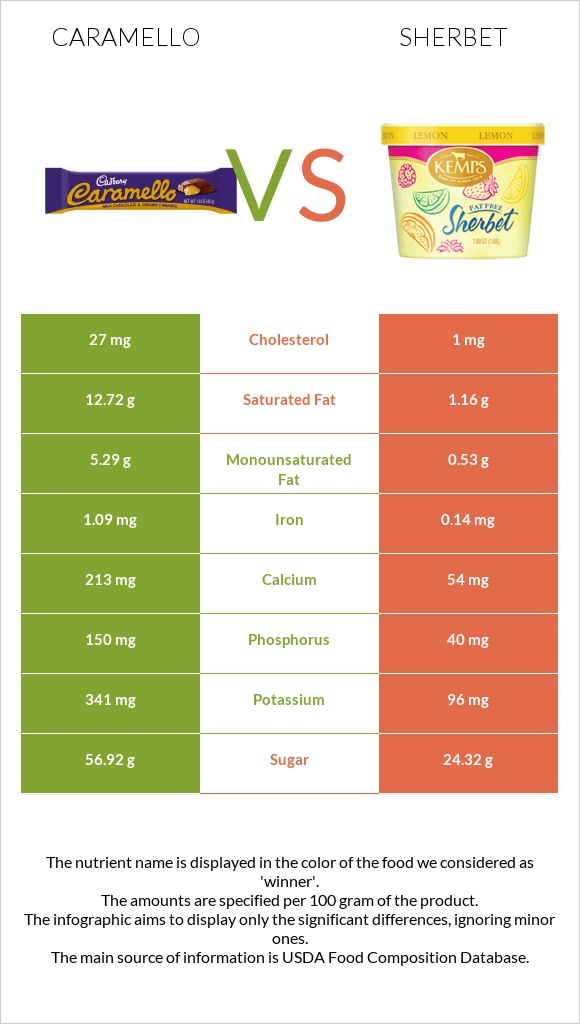
Important differences between caramello and sherbet Sherbet has less calcium, phosphorus, iron, potassium, vitamin A, and monounsaturated fat. Caramello's daily need coverage for saturated fat is 58% more. Caramello has 27 times more cholesterol than sherbet. Caramello has 27mg of cholesterol, while sherbet has 1mg. The food varieties used in the comparison are Candies, CARAMELLO Candy Bar and Sherbet, orange .
Infographic
Mineral Comparison
Mineral comparison score is based on the number of minerals by which one or the other food is richer. The "coverage" charts below show how much of the daily needs can be covered by 300 grams of the food.
4
100 g
300 g
1 bar 1.25 oz - 35g 6 blocks - 43g 1 bar 1.6 oz - 45g
Magnesium
Magnesium
Calcium
Calcium
Potassium
Potassium
Iron
Iron
Copper
Copper
Zinc
Zinc
Phosphorus
Phosphorus
Sodium
Sodium
Manganese
Manganese
Selenium
Selenium
0%
64%
30%
41%
0%
0%
64%
16%
0%
0%
6
100 g
300 g
1 bar (2.75 fl oz) - 66g 0.5 cup (4 fl oz) - 74g
Magnesium
Magnesium
Calcium
Calcium
Potassium
Potassium
Iron
Iron
Copper
Copper
Zinc
Zinc
Phosphorus
Phosphorus
Sodium
Sodium
Manganese
Manganese
Selenium
Selenium
5.7%
16%
8.5%
5.3%
9.3%
13%
17%
6%
1.4%
8.2%
Vitamin Comparison
Vitamin comparison score is based on the number of vitamins by which one or the other food is richer. The "coverage" charts below show how much of the daily needs can be covered by 300 grams of the food.
0
100 g
300 g
1 bar 1.25 oz - 35g 6 blocks - 43g 1 bar 1.6 oz - 45g
Vitamin C
Vit. C
Vitamin D
Vit. D
Vitamin A
Vit. A
Vitamin E
Vit. E
Vitamin B1
Vit. B1
Vitamin B2
Vit. B2
Vitamin B3
Vit. B3
Vitamin B5
Vit. B5
Vitamin B6
Vit. B6
Vitamin B12
Vit. B12
Vitamin K
Vit. K
Folate
Folate
5.7%
0%
0%
0%
0%
0%
0%
0%
0%
0%
0%
0%
10
100 g
300 g
1 bar (2.75 fl oz) - 66g 0.5 cup (4 fl oz) - 74g
Vitamin C
Vit. C
Vitamin D
Vit. D
Vitamin A
Vit. A
Vitamin E
Vit. E
Vitamin B1
Vit. B1
Vitamin B2
Vit. B2
Vitamin B3
Vit. B3
Vitamin B5
Vit. B5
Vitamin B6
Vit. B6
Vitamin B12
Vit. B12
Vitamin K
Vit. K
Folate
Folate
7.7%
0%
4%
0.2%
6.8%
22%
1.2%
13%
5.3%
16%
0%
3%
All nutrients comparison - raw data values
Nutrient
DV% diff.
Saturated fat
12.72g
1.16g
53%
Fats
21.19g
2g
30%
Calories
462kcal
144kcal
16%
Calcium
213mg
54mg
16%
Phosphorus
150mg
40mg
16%
Iron
1.09mg
0.14mg
12%
Monounsaturated fat
5.29g
0.53g
12%
Carbs
63.81g
30.4g
11%
Protein
6.19g
1.1g
10%
Cholesterol
27mg
1mg
9%
Potassium
341mg
96mg
7%
Vitamin B2
0.097mg
7%
Vitamin B12
0.13µg
5%
Zinc
0.48mg
4%
Vitamin B5
0.224mg
4%
Polyunsaturated fat
0.63g
0.08g
4%
Copper
0.028mg
3%
Sodium
122mg
46mg
3%
Selenium
1.5µg
3%
Magnesium
8mg
2%
Vitamin B1
0.027mg
2%
Vitamin B6
0.023mg
2%
Vitamin C
1.7mg
2.3mg
1%
Vitamin A
12µg
1%
Folate
4µg
1%
Choline
7.7mg
1%
Protein per 100 calories
1.3g
0.76g
N/A
Calories per 10 g protein
746kcal
1309kcal
N/A
Weight per 100 calories
22g
69g
N/A
Unsaturated / Saturated Fat ratio
0.47
0.53
N/A
Net carbs
62.61g
29.1g
N/A
Sugar
56.92g
24.32g
N/A
Fiber
1.2g
1.3g
0%
Vitamin E
0.01mg
0%
Manganese
0.011mg
0%
Vitamin B3
0.063mg
0%
Macronutrient Comparison
Macronutrient breakdown side-by-side comparison
4
6%
21%
64%
7%
2%
Protein:
6.19 g
Fats:
21.19 g
Carbs:
63.81 g
Water:
6.79 g
Other:
2.02 g
1
2%
30%
66%
Protein:
1.1 g
Fats:
2 g
Carbs:
30.4 g
Water:
66.1 g
Other:
0.4 g
Contains
more
Protein Protein
+462.7%
Contains
more
Fats Fats
+959.5%
Contains
more
Carbs Carbs
+109.9%
Contains
more
Other Other
+405%
Contains
more
Water Water
+873.5%
Fat Type Comparison
Fat type breakdown side-by-side comparison
2
68%
28%
3%
Saturated fat:
Sat. Fat
12.72 g
Monounsaturated fat:
Mono. Fat
5.29 g
Polyunsaturated fat:
Poly. Fat
0.63 g
1
66%
30%
5%
Saturated fat:
Sat. Fat
1.16 g
Monounsaturated fat:
Mono. Fat
0.53 g
Polyunsaturated fat:
Poly. Fat
0.08 g
Contains
more
Mono. Fat Monounsaturated fat
+898.1%
Contains
more
Poly. Fat Polyunsaturated fat
+687.5%
Contains
less
Sat. Fat Saturated fat
-90.9%