
Chanterelle vs. Napa cabbage — In-Depth Nutrition Comparison
Compare
How are chanterelle and napa cabbage different?
- Chanterelle is higher in iron, copper, vitamin D*, vitamin B3, vitamin B5, vitamin B2, potassium, phosphorus, and zinc; however, napa cabbage is richer in folate.
- Daily need coverage for iron for chanterelle is 34% higher.
Mushrooms, Chanterelle, raw and Cabbage, napa, cooked are the varieties used in this article.
Infographic
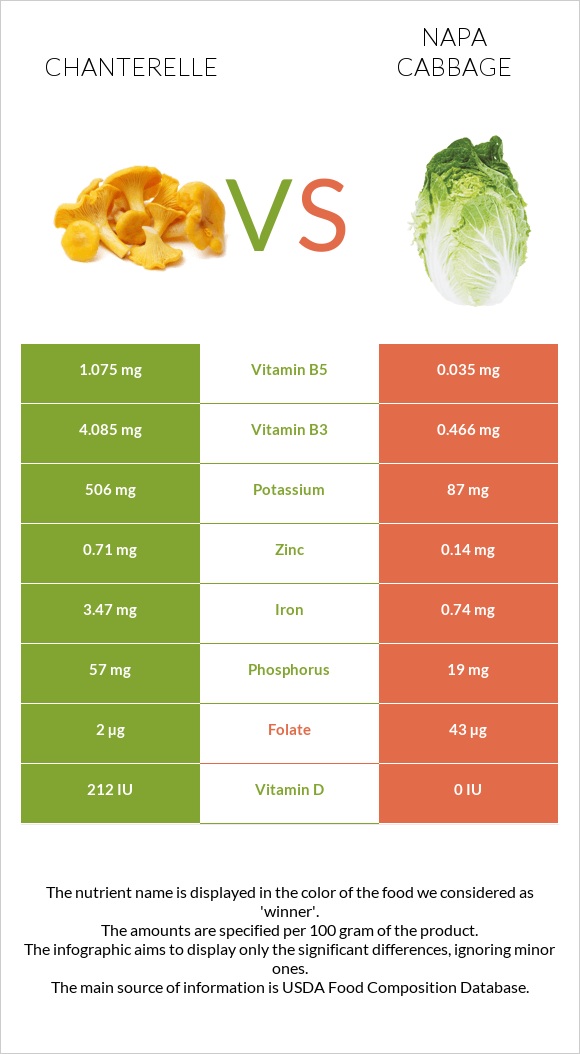
Infographic link
Mineral Comparison
The mineral comparison score is based on which food has a more favorable amount of each mineral. The �coverage� charts below show how much of the daily mineral needs are covered by the selected amount of each food.
| Contains more MagnesiumMagnesium | +62.5% |
| Contains more PotassiumPotassium | +481.6% |
| Contains more IronIron | +368.9% |
| Contains more CopperCopper | +267.7% |
| Contains more ZincZinc | +407.1% |
| Contains more PhosphorusPhosphorus | +200% |
| Contains less SodiumSodium | -18.2% |
| Contains more ManganeseManganese | +40.9% |
| Contains more SeleniumSelenium | +450% |
| Contains more CalciumCalcium | +93.3% |
Vitamin Comparison
The vitamin comparison score is based on the number of vitamins in which one food is richer than the other. The �coverage� charts below show how much of the daily vitamin needs are covered by the selected amount of each food.
| Contains more Vitamin DVitamin D | +∞% |
| Contains more Vitamin B1Vitamin B1 | +200% |
| Contains more Vitamin B2Vitamin B2 | +760% |
| Contains more Vitamin B3Vitamin B3 | +776.6% |
| Contains more Vitamin B5Vitamin B5 | +2971.4% |
| Contains more Vitamin B6Vitamin B6 | +18.9% |
| Contains more Vitamin CVitamin C | +∞% |
| Contains more Vitamin AVitamin A | +∞% |
| Contains more FolateFolate | +2050% |
All nutrients comparison - raw data values
| Nutrient |  |
 |
DV% diff. |
| Iron | 3.47mg | 0.74mg | 34% |
| Copper | 0.353mg | 0.096mg | 29% |
| Vitamin D* | 212 IU | 0 IU | 27% |
| Vitamin D | 5.3µg | 0µg | 27% |
| Vitamin B3 | 4.085mg | 0.466mg | 23% |
| Vitamin B5 | 1.075mg | 0.035mg | 21% |
| Fiber | 3.8g | 15% | |
| Vitamin B2 | 0.215mg | 0.025mg | 15% |
| Potassium | 506mg | 87mg | 12% |
| Folate | 2µg | 43µg | 10% |
| Zinc | 0.71mg | 0.14mg | 5% |
| Phosphorus | 57mg | 19mg | 5% |
| Vitamin C | 3.2mg | 4% | |
| Manganese | 0.286mg | 0.203mg | 4% |
| Selenium | 2.2µg | 0.4µg | 3% |
| Carbs | 6.86g | 2.23g | 2% |
| Calories | 38kcal | 12kcal | 1% |
| Protein | 1.49g | 1.1g | 1% |
| Fats | 0.53g | 0.17g | 1% |
| Magnesium | 13mg | 8mg | 1% |
| Calcium | 15mg | 29mg | 1% |
| Vitamin A | 13µg | 1% | |
| Vitamin B1 | 0.015mg | 0.005mg | 1% |
| Vitamin B6 | 0.044mg | 0.037mg | 1% |
| Protein per 100 calories | 3.9g | 9.2g | N/A |
| Calories per 10 g protein | 255kcal | 109kcal | N/A |
| Weight per 100 calories | 263g | 833g | N/A |
| Net carbs | 3.06g | 2.23g | N/A |
| Sugar | 1.16g | N/A | |
| Sodium | 9mg | 11mg | 0% |
Macronutrient Comparison
Macronutrient breakdown side-by-side comparison
Protein:
1.49 g
Fats:
0.53 g
Carbs:
6.86 g
Water:
89.85 g
Other:
1.27 g
Protein:
1.1 g
Fats:
0.17 g
Carbs:
2.23 g
Water:
96.33 g
Other:
0.17 g
| Contains more ProteinProtein | +35.5% |
| Contains more FatsFats | +211.8% |
| Contains more CarbsCarbs | +207.6% |
~equal in
Water
~96.33g


