Orange chicken vs. Sesame chicken — In-Depth Nutrition Comparison
Compare
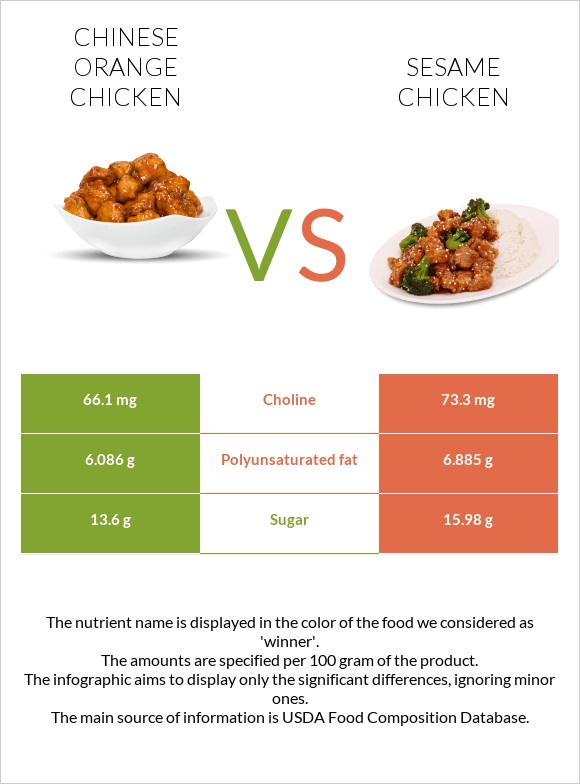
Important differences between orange chicken and sesame chicken
- Orange chicken has less polyunsaturated fat.
- Orange chicken is lower in sugar.
The food varieties used in the comparison are Restaurant, Chinese, orange chicken and Restaurant, Chinese, sesame chicken.
Infographic
Infographic link
Mineral Comparison
Mineral comparison score is based on the number of minerals by which one or the other food is richer. The "coverage" charts below show how much of the daily needs can be covered by 300 grams of the food.
| Contains more CalciumCalcium | +16.7% |
| Contains more ZincZinc | +24.2% |
| Contains more IronIron | +16% |
| Contains more CopperCopper | +21.4% |
| Contains less SodiumSodium | -12.8% |
Vitamin Comparison
Vitamin comparison score is based on the number of vitamins by which one or the other food is richer. The "coverage" charts below show how much of the daily needs can be covered by 300 grams of the food.
| Contains more Vitamin B5Vitamin B5 | +∞% |
| Contains more FolateFolate | +25% |
| Contains more Vitamin CVitamin C | +11.1% |
| Contains more Vitamin AVitamin A | +10.7% |
| Contains more Vitamin EVitamin E | +22.4% |
| Contains more Vitamin B3Vitamin B3 | +10.3% |
| Contains more Vitamin B6Vitamin B6 | +16.1% |
| Contains more Vitamin B12Vitamin B12 | +25% |
| Contains more Vitamin KVitamin K | +11.1% |
All nutrients comparison - raw data values
| Nutrient |  |
 |
DV% diff. |
| Vitamin B5 | 1mg | 20% | |
| Polyunsaturated fat | 6.086g | 6.885g | 5% |
| Sodium | 553mg | 482mg | 3% |
| Vitamin B6 | 0.23mg | 0.267mg | 3% |
| Calories | 262kcal | 293kcal | 2% |
| Fats | 12.68g | 14.25g | 2% |
| Iron | 0.94mg | 1.09mg | 2% |
| Zinc | 1.13mg | 0.91mg | 2% |
| Vitamin E | 1.07mg | 1.31mg | 2% |
| Vitamin B3 | 3.59mg | 3.96mg | 2% |
| Vitamin B12 | 0.2µg | 0.25µg | 2% |
| Vitamin K | 24.4µg | 27.1µg | 2% |
| Fructose | 0.67g | 2.01g | 2% |
| Carbs | 22.46g | 26.88g | 1% |
| Cholesterol | 61mg | 59mg | 1% |
| Copper | 0.042mg | 0.051mg | 1% |
| Vitamin A | 75µg | 83µg | 1% |
| Selenium | 17.1µg | 16.7µg | 1% |
| Folate | 10µg | 8µg | 1% |
| Choline | 66.1mg | 73.3mg | 1% |
| Protein | 14.46g | 14.33g | 0% |
| Protein per 100 calories | 5.5g | 4.9g | N/A |
| Calories per 10 g protein | 181kcal | 204kcal | N/A |
| Weight per 100 calories | 38g | 34g | N/A |
| Unsaturated / Saturated Fat ratio | 3.9 | 4.3 | N/A |
| Vitamin C | 0.9mg | 1mg | 0% |
| Net carbs | 21.66g | 26.18g | N/A |
| Vitamin D* | 5 IU | 5 IU | 0% |
| Vitamin D | 0.1µg | 0.1µg | 0% |
| Magnesium | 20mg | 22mg | 0% |
| Calcium | 14mg | 12mg | 0% |
| Potassium | 209mg | 204mg | 0% |
| Sugar | 13.6g | 15.98g | N/A |
| Fiber | 0.8g | 0.7g | 0% |
| Starch | 10.5g | 10.7g | 0% |
| Phosphorus | 130mg | 130mg | 0% |
| Manganese | 0.087mg | 0.083mg | 0% |
| Vitamin B1 | 0.043mg | 0.04mg | 0% |
| Vitamin B2 | 0.22mg | 0.225mg | 0% |
| Trans fat | 0.053g | 0.045g | N/A |
| Saturated fat | 2.422g | 2.41g | 0% |
| Monounsaturated fat | 3.474g | 3.546g | 0% |
| Tryptophan | 0.113mg | 0% | |
| Threonine | 0.576mg | 0% | |
| Isoleucine | 0.576mg | 0% | |
| Leucine | 1.001mg | 0% | |
| Lysine | 1.058mg | 0% | |
| Methionine | 0.34mg | 0% | |
| Phenylalanine | 0.51mg | 0% | |
| Valine | 0.614mg | 0% | |
| Histidine | 0.359mg | 0% | |
| Omega-3 - EPA | 0.001g | 0.003g | N/A |
| Omega-3 - DHA | 0.005g | 0.005g | N/A |
| Omega-3 - ALA | 0.619g | 0.774g | N/A |
| Omega-3 - DPA | 0.003g | 0.006g | N/A |
| Omega-3 - Eicosatrienoic acid | 0g | 0.001g | N/A |
| Omega-6 - Gamma-linoleic acid | 0.028g | 0.039g | N/A |
| Omega-6 - Dihomo-gamma-linoleic acid | 0.01g | 0.009g | N/A |
| Omega-6 - Eicosadienoic acid | 0.008g | 0.009g | N/A |
| Omega-6 - Linoleic acid | 5.284g | 5.925g | N/A |
Macronutrient Comparison
Macronutrient breakdown side-by-side comparison
Protein:
14.46 g
Fats:
12.68 g
Carbs:
22.46 g
Water:
48.43 g
Other:
1.97 g
Protein:
14.33 g
Fats:
14.25 g
Carbs:
26.88 g
Water:
42.8 g
Other:
1.74 g
| Contains more WaterWater | +13.2% |
| Contains more OtherOther | +13.2% |
| Contains more FatsFats | +12.4% |
| Contains more CarbsCarbs | +19.7% |
~equal in
Protein
~14.33g
Fat Type Comparison
Fat type breakdown side-by-side comparison
Saturated fat:
Sat. Fat
2.422 g
Monounsaturated fat:
Mono. Fat
3.474 g
Polyunsaturated fat:
Poly. Fat
6.086 g
Saturated fat:
Sat. Fat
2.41 g
Monounsaturated fat:
Mono. Fat
3.546 g
Polyunsaturated fat:
Poly. Fat
6.885 g
| Contains more Poly. FatPolyunsaturated fat | +13.1% |
~equal in
Saturated fat
~2.41g
~equal in
Monounsaturated fat
~3.546g
Carbohydrate type comparison
Carbohydrate type breakdown side-by-side comparison
Starch:
10.5 g
Sucrose:
12.3 g
Glucose:
0.63 g
Fructose:
0.67 g
Lactose:
0 g
Maltose:
0 g
Galactose:
0 g
Starch:
10.7 g
Sucrose:
11.79 g
Glucose:
2.18 g
Fructose:
2.01 g
Lactose:
0 g
Maltose:
0 g
Galactose:
0 g
| Contains more GlucoseGlucose | +246% |
| Contains more FructoseFructose | +200% |
~equal in
Starch
~10.7g
~equal in
Sucrose
~11.79g
~equal in
Lactose
~0g
~equal in
Maltose
~0g
~equal in
Galactose
~0g

