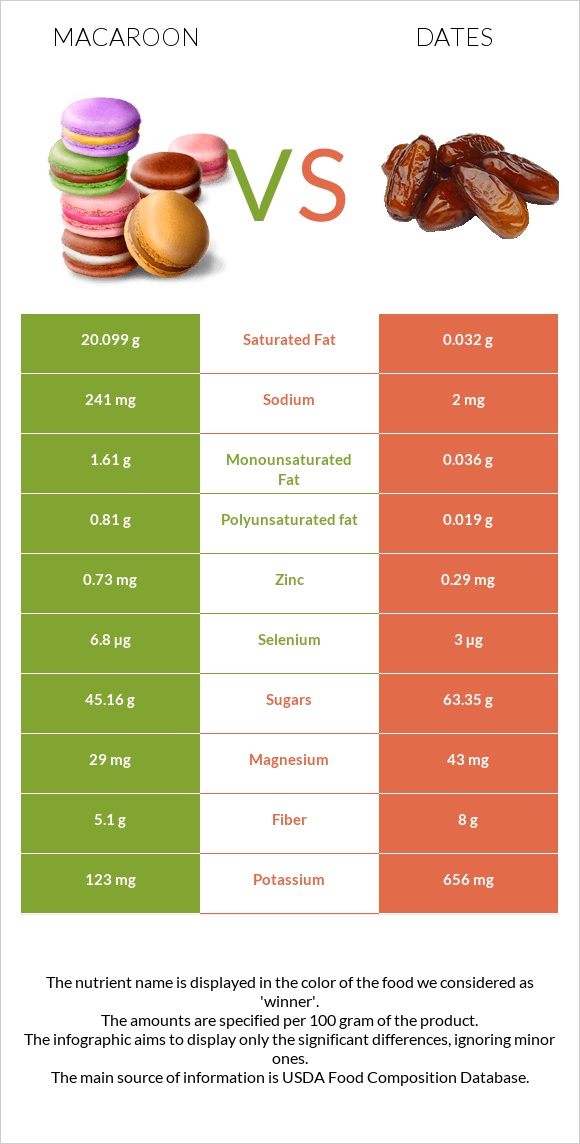
What are the main differences between macaroon and dates? Macaroon is richer in copper and selenium, while dates are higher in potassium, fiber, vitamin B3, and vitamin B6. Macaroon's daily need coverage for saturated fat is 100% higher. Dates have 121 times less sodium than macaroon. Macaroon has 241mg of sodium, while dates have 2mg. Dates are lower in saturated fat. We used Cookies, coconut macaroon and Dates, deglet noor types in this comparison.
Infographic
Mineral Comparison
Mineral comparison score is based on the number of minerals by which one or the other food is richer. The "coverage" charts below show how much of the daily needs can be covered by 300 grams of the food.
3
100 g
300 g
2 cookie 1 serving - 36g
Magnesium
Magnesium
Calcium
Calcium
Potassium
Potassium
Iron
Iron
Copper
Copper
Zinc
Zinc
Phosphorus
Phosphorus
Sodium
Sodium
Manganese
Manganese
Selenium
Selenium
21%
1.5%
11%
31%
90%
20%
29%
31%
0%
37%
6
100 g
300 g
1 date, pitted - 7.1g 1 cup, chopped - 147g
Magnesium
Magnesium
Calcium
Calcium
Potassium
Potassium
Iron
Iron
Copper
Copper
Zinc
Zinc
Phosphorus
Phosphorus
Sodium
Sodium
Manganese
Manganese
Selenium
Selenium
31%
12%
58%
38%
69%
7.9%
27%
0.26%
34%
16%
Vitamin Comparison
Vitamin comparison score is based on the number of vitamins by which one or the other food is richer. The "coverage" charts below show how much of the daily needs can be covered by 300 grams of the food.
1
100 g
300 g
2 cookie 1 serving - 36g
Vitamin C
Vit. C
Vitamin D
Vit. D
Vitamin A
Vit. A
Vitamin E
Vit. E
Vitamin B1
Vit. B1
Vitamin B2
Vit. B2
Vitamin B3
Vit. B3
Vitamin B5
Vit. B5
Vitamin B6
Vit. B6
Vitamin B12
Vit. B12
Vitamin K
Vit. K
Folate
Folate
0%
0%
0%
3.8%
5%
14%
4.1%
0%
22%
0%
2.8%
2.3%
7
100 g
300 g
1 date, pitted - 7.1g 1 cup, chopped - 147g
Vitamin C
Vit. C
Vitamin D
Vit. D
Vitamin A
Vit. A
Vitamin E
Vit. E
Vitamin B1
Vit. B1
Vitamin B2
Vit. B2
Vitamin B3
Vit. B3
Vitamin B5
Vit. B5
Vitamin B6
Vit. B6
Vitamin B12
Vit. B12
Vitamin K
Vit. K
Folate
Folate
1.3%
0%
0%
1%
13%
15%
24%
35%
38%
0%
6.8%
14%
All nutrients comparison - raw data values
Nutrient
DV% diff.
Saturated fat
20.099g
0.032g
91%
Fats
22.55g
0.39g
34%
Fructose
19.56g
24%
Potassium
123mg
656mg
16%
Fiber
5.1g
8g
12%
Vitamin B5
0.589mg
12%
Manganese
0.262mg
11%
Sodium
241mg
2mg
10%
Calories
460kcal
282kcal
9%
Copper
0.269mg
0.206mg
7%
Selenium
6.8µg
3µg
7%
Vitamin B3
0.22mg
1.274mg
7%
Carbs
61.22g
75.03g
5%
Vitamin B6
0.096mg
0.165mg
5%
Polyunsaturated fat
0.81g
0.019g
5%
Zinc
0.73mg
0.29mg
4%
Folate
3µg
19µg
4%
Monounsaturated fat
1.61g
0.036g
4%
Magnesium
29mg
43mg
3%
Calcium
5mg
39mg
3%
Iron
0.82mg
1.02mg
3%
Vitamin B1
0.02mg
0.052mg
3%
Protein
3.02g
2.45g
1%
Phosphorus
68mg
62mg
1%
Vitamin E
0.19mg
0.05mg
1%
Vitamin K
1.1µg
2.7µg
1%
Choline
9.1mg
6.3mg
1%
Weight per 100 calories
22g
35g
N/A
Unsaturated / Saturated Fat ratio
0.12
1.7
N/A
Vitamin C
0mg
0.4mg
0%
Net carbs
56.12g
67.03g
N/A
Sugar
45.16g
63.35g
N/A
Vitamin B2
0.06mg
0.066mg
0%
Tryptophan
0.012mg
0%
Threonine
0.043mg
0%
Isoleucine
0.049mg
0%
Leucine
0.084mg
0%
Lysine
0.066mg
0%
Methionine
0.022mg
0%
Phenylalanine
0.05mg
0%
Valine
0.071mg
0%
Histidine
0.032mg
0%
Macronutrient Comparison
Macronutrient breakdown side-by-side comparison
3
3%
23%
61%
12%
2%
Protein:
3.02 g
Fats:
22.55 g
Carbs:
61.22 g
Water:
11.5 g
Other:
1.71 g
2
2%
75%
21%
Protein:
2.45 g
Fats:
0.39 g
Carbs:
75.03 g
Water:
20.53 g
Other:
1.6 g
Contains
more
Protein Protein
+23.3%
Contains
more
Fats Fats
+5682.1%
Contains
more
Carbs Carbs
+22.6%
Contains
more
Water Water
+78.5%
Fat Type Comparison
Fat type breakdown side-by-side comparison
2
89%
7%
4%
Saturated fat:
Sat. Fat
20.099 g
Monounsaturated fat:
Mono. Fat
1.61 g
Polyunsaturated fat:
Poly. Fat
0.81 g
1
37%
41%
22%
Saturated fat:
Sat. Fat
0.032 g
Monounsaturated fat:
Mono. Fat
0.036 g
Polyunsaturated fat:
Poly. Fat
0.019 g
Contains
more
Mono. Fat Monounsaturated fat
+4372.2%
Contains
more
Poly. Fat Polyunsaturated fat
+4163.2%
Contains
less
Sat. Fat Saturated fat
-99.8%