Foodstruct Nutrition Search | Diet Analysis | Food Comparison | Glycemic Index Chart | Insulin Index Chart | Blog | Subscribe | Sign Up

Coriander vs. Fenugreek — In-Depth Nutrition Comparison

Compare

The main differences between coriander and fenugreek

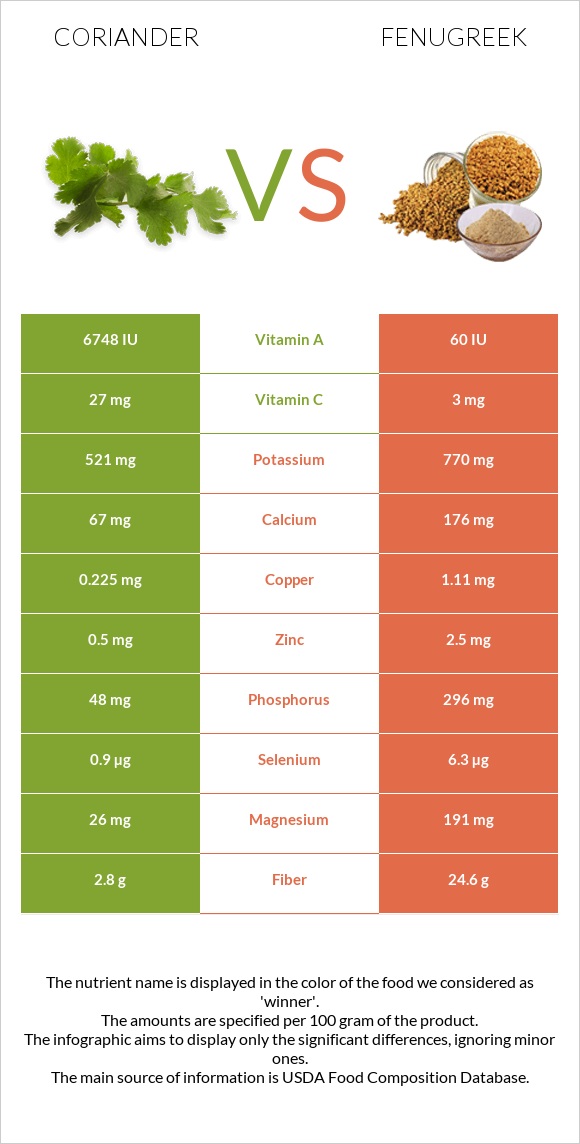
  • Coriander is richer in vitamin A and vitamin C, yet fenugreek is richer in iron, copper, fiber, protein, magnesium, phosphorus, manganese, and vitamin B6.
  • Daily need coverage for iron for fenugreek is 397% higher.
  • Coriander contains 112 times more vitamin A than fenugreek. Coriander contains 337µg of vitamin A, while fenugreek contains 3µg.
  • Fenugreek has a lower glycemic index than coriander.

Food types used in this article are Coriander (cilantro) leaves, raw and Spices, fenugreek seed.

Infographic

Coriander vs Fenugreek infographic
Infographic link

Mineral Comparison

The mineral comparison score is based on which food has a more favorable amount of each mineral. The �coverage� charts below show how much of the daily mineral needs are covered by the selected amount of each food.
Magnesium Magnesium Calcium Calcium Potassium Potassium Iron Iron Copper Copper Zinc Zinc Phosphorus Phosphorus Sodium Sodium Manganese Manganese Selenium Selenium 19% 20% 46% 66% 75% 14% 21% 6% 56% 4.9%
Magnesium Magnesium Calcium Calcium Potassium Potassium Iron Iron Copper Copper Zinc Zinc Phosphorus Phosphorus Sodium Sodium Manganese Manganese Selenium Selenium 136% 53% 68% 1257% 370% 68% 127% 8.7% 160% 34%
Contains less SodiumSodium -31.3%
Contains more MagnesiumMagnesium +634.6%
Contains more CalciumCalcium +162.7%
Contains more PotassiumPotassium +47.8%
Contains more IronIron +1794.4%
Contains more CopperCopper +393.3%
Contains more ZincZinc +400%
Contains more PhosphorusPhosphorus +516.7%
Contains more ManganeseManganese +188.3%
Contains more SeleniumSelenium +600%

Vitamin Comparison

The vitamin comparison score is based on the number of vitamins in which one food is richer than the other. The �coverage� charts below show how much of the daily vitamin needs are covered by the selected amount of each food.
Vitamin C Vit. C Vitamin D Vit. D Vitamin A Vit. A Vitamin E Vit. E Vitamin B1 Vit. B1 Vitamin B2 Vit. B2 Vitamin B3 Vit. B3 Vitamin B5 Vit. B5 Vitamin B6 Vit. B6 Vitamin B12 Vit. B12 Vitamin K Vit. K Folate Folate 90% 0% 112% 50% 17% 37% 21% 34% 34% 0% 775% 47%
Vitamin C Vit. C Vitamin D Vit. D Vitamin A Vit. A Vitamin E Vit. E Vitamin B1 Vit. B1 Vitamin B2 Vit. B2 Vitamin B3 Vit. B3 Vitamin B5 Vit. B5 Vitamin B6 Vit. B6 Vitamin B12 Vit. B12 Vitamin K Vit. K Folate Folate 10% 0% 1% 0% 81% 84% 31% 0% 138% 0% 0% 43%
Contains more Vitamin CVitamin C +800%
Contains more Vitamin AVitamin A +11133.3%
Contains more Vitamin EVitamin E +∞%
Contains more Vitamin B5Vitamin B5 +∞%
Contains more Vitamin KVitamin K +∞%
Contains more Vitamin B1Vitamin B1 +380.6%
Contains more Vitamin B2Vitamin B2 +125.9%
Contains more Vitamin B3Vitamin B3 +47.2%
Contains more Vitamin B6Vitamin B6 +302.7%
~equal in Vitamin D ~0µg
~equal in Vitamin B12 ~0µg
~equal in Folate ~57µg

All nutrients comparison - raw data values

Nutrient Coriander Fenugreek DV% diff.
Iron 1.77mg 33.53mg 397%
Vitamin K 310µg 258%
Copper 0.225mg 1.11mg 98%
Fiber 2.8g 24.6g 87%
Protein 2.13g 23g 42%
Magnesium 26mg 191mg 39%
Vitamin A 337µg 3µg 37%
Phosphorus 48mg 296mg 35%
Manganese 0.426mg 1.228mg 35%
Vitamin B6 0.149mg 0.6mg 35%
Vitamin C 27mg 3mg 27%
Vitamin B1 0.067mg 0.322mg 21%
Carbs 3.67g 58.35g 18%
Zinc 0.5mg 2.5mg 18%
Vitamin E 2.5mg 17%
Vitamin B2 0.162mg 0.366mg 16%
Calories 23kcal 323kcal 15%
Calcium 67mg 176mg 11%
Vitamin B5 0.57mg 11%
Selenium 0.9µg 6.3µg 10%
Fats 0.52g 6.41g 9%
Potassium 521mg 770mg 7%
Saturated fat 0.014g 1.46g 7%
Vitamin B3 1.114mg 1.64mg 3%
Choline 12.8mg 2%
Sodium 46mg 67mg 1%
Folate 62µg 57µg 1%
Monounsaturated fat 0.275g 1%
Protein per 100 calories 9.3g 7.1g N/A
Calories per 10 g protein 108kcal 140kcal N/A
Weight per 100 calories 435g 31g N/A
Unsaturated / Saturated Fat ratio 23 0 N/A
Net carbs 0.87g 33.75g N/A
Sugar 0.87g N/A
Polyunsaturated fat 0.04g 0%
Tryptophan 0.391mg 0%
Threonine 0.898mg 0%
Isoleucine 1.241mg 0%
Leucine 1.757mg 0%
Lysine 1.684mg 0%
Methionine 0.338mg 0%
Phenylalanine 1.089mg 0%
Valine 1.102mg 0%
Histidine 0.668mg 0%

Macronutrient Comparison

Macronutrient breakdown side-by-side comparison
2% 4% 92%
Protein: 2.13 g
Fats: 0.52 g
Carbs: 3.67 g
Water: 92.21 g
Other: 1.47 g
23% 6% 58% 9% 3%
Protein: 23 g
Fats: 6.41 g
Carbs: 58.35 g
Water: 8.84 g
Other: 3.4 g
Contains more WaterWater +943.1%
Contains more ProteinProtein +979.8%
Contains more FatsFats +1132.7%
Contains more CarbsCarbs +1489.9%

Fat Type Comparison

Fat type breakdown side-by-side comparison
4% 84% 12%
Saturated fat: Sat. Fat 0.014 g
Monounsaturated fat: Mono. Fat 0.275 g
Polyunsaturated fat: Poly. Fat 0.04 g
100%
Saturated fat: Sat. Fat 1.46 g
Monounsaturated fat: Mono. Fat 0 g
Polyunsaturated fat: Poly. Fat 0 g
Contains less Sat. FatSaturated fat -99%
Contains more Mono. FatMonounsaturated fat +∞%
Contains more Poly. FatPolyunsaturated fat +∞%

People also compare

References

All the values for which the sources are not specified explicitly are taken from FDA’s Food Central. The exact link to the food presented on this page can be found below.

  1. Coriander - https://fdc.nal.usda.gov/fdc-app.html#/food-details/169997/nutrients
  2. Fenugreek - https://fdc.nal.usda.gov/fdc-app.html#/food-details/171324/nutrients

All the Daily Values are presented for males aged 31-50, for 2000-calorie diets.

Data provided by FoodStruct.com should be considered and used as information only. Please consult your physician before beginning any diet.