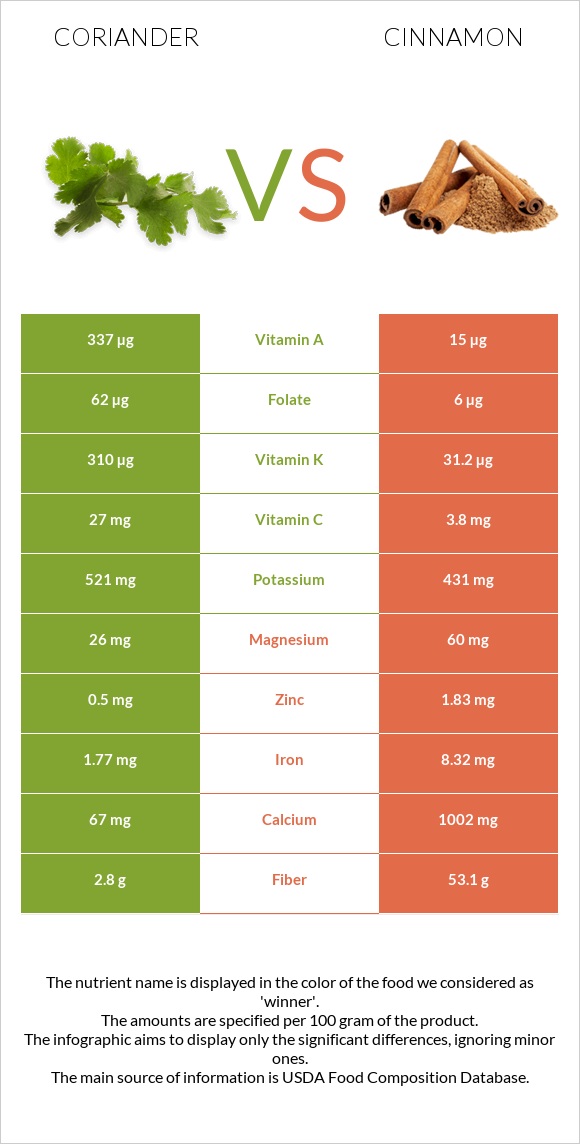
A recap on the differences between coriander and cinnamon Coriander has more vitamin K, vitamin A, vitamin C, and folate; however, cinnamon is higher in manganese, fiber, calcium, iron, copper, and zinc. Cinnamon covers your daily manganese needs 741% more than coriander. Cinnamon contains 23 times less vitamin A than coriander. Coriander contains 6748 IU of vitamin A, while cinnamon contains 295 IU. Food varieties used in this article are Coriander (cilantro) leaves, raw and Spices, cinnamon, ground .
Infographic
Mineral Comparison
Mineral comparison score is based on the number of minerals by which one or the other food is richer. The "coverage" charts below show how much of the daily needs can be covered by 300 grams of the food.
1
100 g
300 g
0.25 cup - 4g 9 sprigs - 20g
Magnesium
Magnesium
Calcium
Calcium
Potassium
Potassium
Iron
Iron
Copper
Copper
Zinc
Zinc
Phosphorus
Phosphorus
Sodium
Sodium
Manganese
Manganese
Selenium
Selenium
19%
20%
46%
66%
75%
14%
21%
6%
56%
4.9%
9
100 g
300 g
0.25 tsp - 0.5g 1 tbsp - 7.8g
Magnesium
Magnesium
Calcium
Calcium
Potassium
Potassium
Iron
Iron
Copper
Copper
Zinc
Zinc
Phosphorus
Phosphorus
Sodium
Sodium
Manganese
Manganese
Selenium
Selenium
43%
301%
38%
312%
113%
50%
27%
1.3%
2278%
17%
Vitamin Comparison
Vitamin comparison score is based on the number of vitamins by which one or the other food is richer. The "coverage" charts below show how much of the daily needs can be covered by 300 grams of the food.
7
100 g
300 g
0.25 cup - 4g 9 sprigs - 20g
Vitamin C
Vit. C
Vitamin D
Vit. D
Vitamin A
Vit. A
Vitamin E
Vit. E
Vitamin B1
Vit. B1
Vitamin B2
Vit. B2
Vitamin B3
Vit. B3
Vitamin B5
Vit. B5
Vitamin B6
Vit. B6
Vitamin B12
Vit. B12
Vitamin K
Vit. K
Folate
Folate
90%
0%
112%
50%
17%
37%
21%
34%
34%
0%
775%
47%
1
100 g
300 g
0.25 tsp - 0.5g 1 tbsp - 7.8g
Vitamin C
Vit. C
Vitamin D
Vit. D
Vitamin A
Vit. A
Vitamin E
Vit. E
Vitamin B1
Vit. B1
Vitamin B2
Vit. B2
Vitamin B3
Vit. B3
Vitamin B5
Vit. B5
Vitamin B6
Vit. B6
Vitamin B12
Vit. B12
Vitamin K
Vit. K
Folate
Folate
13%
0%
5%
46%
5.5%
9.5%
25%
21%
36%
0%
78%
4.5%
All nutrients comparison - raw data values
Nutrient
DV% diff.
Manganese
0.426mg
17.466mg
741%
Vitamin K
310µg
31.2µg
232%
Fiber
2.8g
53.1g
201%
Calcium
67mg
1002mg
94%
Iron
1.77mg
8.32mg
82%
Vitamin A
337µg
15µg
36%
Vitamin C
27mg
3.8mg
26%
Carbs
3.67g
80.59g
26%
Folate
62µg
6µg
14%
Copper
0.225mg
0.339mg
13%
Zinc
0.5mg
1.83mg
12%
Calories
23kcal
247kcal
11%
Vitamin B2
0.162mg
0.041mg
9%
Magnesium
26mg
60mg
8%
Protein
2.13g
3.99g
4%
Selenium
0.9µg
3.1µg
4%
Vitamin B1
0.067mg
0.022mg
4%
Vitamin B5
0.57mg
0.358mg
4%
Potassium
521mg
431mg
3%
Phosphorus
48mg
64mg
2%
Sodium
46mg
10mg
2%
Saturated fat
0.014g
0.345g
2%
Fats
0.52g
1.24g
1%
Vitamin E
2.5mg
2.32mg
1%
Vitamin B3
1.114mg
1.332mg
1%
Vitamin B6
0.149mg
0.158mg
1%
Fructose
1.11g
1%
Protein per 100 calories
9.3g
1.6g
N/A
Calories per 10 g protein
108kcal
619kcal
N/A
Weight per 100 calories
435g
40g
N/A
Net carbs
0.87g
27.49g
N/A
Sugar
0.87g
2.17g
N/A
Choline
12.8mg
11mg
0%
Monounsaturated fat
0.275g
0.246g
0%
Polyunsaturated fat
0.04g
0.068g
0%
Tryptophan
0.049mg
0%
Threonine
0.136mg
0%
Isoleucine
0.146mg
0%
Leucine
0.253mg
0%
Lysine
0.243mg
0%
Methionine
0.078mg
0%
Phenylalanine
0.146mg
0%
Valine
0.224mg
0%
Histidine
0.117mg
0%
Omega-3 - ALA
0.011g
N/A
Macronutrient Comparison
Macronutrient breakdown side-by-side comparison
1
2%
4%
92%
Protein:
2.13 g
Fats:
0.52 g
Carbs:
3.67 g
Water:
92.21 g
Other:
1.47 g
4
4%
81%
11%
4%
Protein:
3.99 g
Fats:
1.24 g
Carbs:
80.59 g
Water:
10.58 g
Other:
3.6 g
Contains
more
Water Water
+771.6%
Contains
more
Protein Protein
+87.3%
Contains
more
Fats Fats
+138.5%
Contains
more
Carbs Carbs
+2095.9%
Contains
more
Other Other
+144.9%
Fat Type Comparison
Fat type breakdown side-by-side comparison
2
4%
84%
12%
Saturated fat:
Sat. Fat
0.014 g
Monounsaturated fat:
Mono. Fat
0.275 g
Polyunsaturated fat:
Poly. Fat
0.04 g
1
52%
37%
10%
Saturated fat:
Sat. Fat
0.345 g
Monounsaturated fat:
Mono. Fat
0.246 g
Polyunsaturated fat:
Poly. Fat
0.068 g
Contains
less
Sat. Fat Saturated fat
-95.9%
Contains
more
Mono. Fat Monounsaturated fat
+11.8%
Contains
more
Poly. Fat Polyunsaturated fat
+70%