Important differences between cornbread and crackers Cornbread has more phosphorus and vitamin B12; however, crackers have more vitamin K, iron, vitamin B2, vitamin B1, vitamin E, vitamin B3, and manganese. Crackers' daily need coverage for vitamin K is 55% more. Cornbread has a higher glycemic index than crackers. The food varieties used in the comparison are Bread, cornbread, dry mix, prepared with 2% milk, 80% margarine, and eggs and Crackers, standard snack-type, regular .
Infographic
Mineral Comparison
Mineral comparison score is based on the number of minerals by which one or the other food is richer. The "coverage" charts below show how much of the daily needs can be covered by 300 grams of the food.
6
100 g
300 g
1 oz - 28.35g 1 muffin - 51g 1 piece - 60g
Magnesium
Magnesium
Calcium
Calcium
Potassium
Potassium
Iron
Iron
Copper
Copper
Zinc
Zinc
Phosphorus
Phosphorus
Sodium
Sodium
Manganese
Manganese
Selenium
Selenium
12%
41%
12%
69%
24%
18%
168%
78%
29%
47%
3
100 g
300 g
1 cracker, round - 3.2g 1 cracker, rectangular - 4g 5 crackers - 16g 5 crackers, regular size, round (1 serving) - 16g 1 cup crushed - 52g
Magnesium
Magnesium
Calcium
Calcium
Potassium
Potassium
Iron
Iron
Copper
Copper
Zinc
Zinc
Phosphorus
Phosphorus
Sodium
Sodium
Manganese
Manganese
Selenium
Selenium
13%
36%
10%
151%
35%
13%
106%
95%
64%
37%
Vitamin Comparison
Vitamin comparison score is based on the number of vitamins by which one or the other food is richer. The "coverage" charts below show how much of the daily needs can be covered by 300 grams of the food.
5
100 g
300 g
1 oz - 28.35g 1 muffin - 51g 1 piece - 60g
Vitamin C
Vit. C
Vitamin D
Vit. D
Vitamin A
Vit. A
Vitamin E
Vit. E
Vitamin B1
Vit. B1
Vitamin B2
Vit. B2
Vitamin B3
Vit. B3
Vitamin B5
Vit. B5
Vitamin B6
Vit. B6
Vitamin B12
Vit. B12
Vitamin K
Vit. K
Folate
Folate
0.33%
0%
12%
10%
48%
40%
38%
35%
20%
29%
9.3%
41%
6
100 g
300 g
1 cracker, round - 3.2g 1 cracker, rectangular - 4g 5 crackers - 16g 5 crackers, regular size, round (1 serving) - 16g 1 cup crushed - 52g
Vitamin C
Vit. C
Vitamin D
Vit. D
Vitamin A
Vit. A
Vitamin E
Vit. E
Vitamin B1
Vit. B1
Vitamin B2
Vit. B2
Vitamin B3
Vit. B3
Vitamin B5
Vit. B5
Vitamin B6
Vit. B6
Vitamin B12
Vit. B12
Vitamin K
Vit. K
Folate
Folate
0%
0%
0%
61%
104%
105%
82%
25%
15%
0%
173%
69%
All nutrients comparison - raw data values
Nutrient
DV% diff.
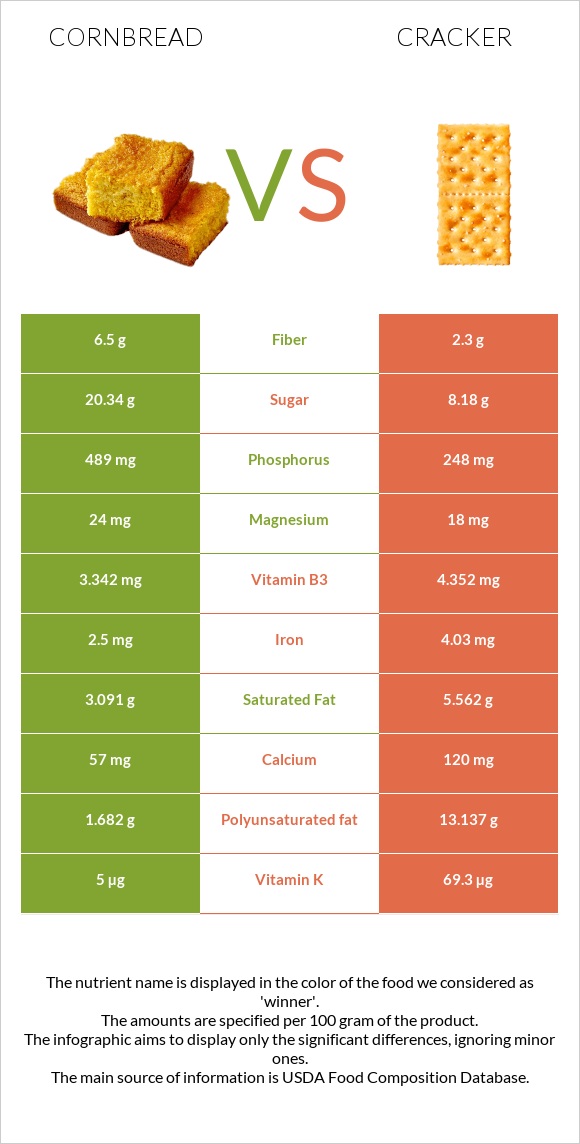
Polyunsaturated fat
1.963g
13.137g
74%
Vitamin K
3.7µg
69.3µg
55%
Iron
1.85mg
4.03mg
27%
Fats
9.58g
26.43g
26%
Vitamin B2
0.175mg
0.456mg
22%
Phosphorus
391mg
248mg
20%
Cholesterol
57mg
0mg
19%
Vitamin B1
0.19mg
0.416mg
19%
Vitamin E
0.51mg
3.03mg
17%
Vitamin B3
2.004mg
4.352mg
15%
Manganese
0.222mg
0.491mg
12%
Vitamin B12
0.23µg
0µg
10%
Calories
330kcal
510kcal
9%
Folate
55µg
92µg
9%
Choline
58.7mg
9.6mg
9%
Saturated fat
3.732g
5.562g
8%
Monounsaturated fat
3.494g
6.553g
8%
Starch
35.66g
49.69g
6%
Sodium
599mg
726mg
6%
Vitamin A
35µg
0µg
4%
Selenium
8.7µg
6.7µg
4%
Copper
0.073mg
0.104mg
3%
Vitamin B5
0.579mg
0.417mg
3%
Carbs
54.46g
61.3g
2%
Calcium
135mg
120mg
2%
Zinc
0.67mg
0.49mg
2%
Vitamin B6
0.085mg
0.063mg
2%
Protein
6.59g
6.64g
0%
Protein per 100 calories
2g
1.3g
N/A
Calories per 10 g protein
501kcal
768kcal
N/A
Weight per 100 calories
30g
20g
N/A
Unsaturated / Saturated Fat ratio
1.5
3.5
N/A
Vitamin C
0.1mg
0mg
0%
Net carbs
52.16g
59g
N/A
Magnesium
17mg
18mg
0%
Potassium
133mg
118mg
0%
Sugar
16.05g
8.18g
N/A
Fiber
2.3g
2.3g
0%
Trans fat
0.224g
1.076g
N/A
Tryptophan
0.059mg
0.084mg
0%
Threonine
0.226mg
0.193mg
0%
Isoleucine
0.265mg
0.246mg
0%
Leucine
0.658mg
0.471mg
0%
Lysine
0.324mg
0.103mg
0%
Methionine
0.157mg
0.112mg
0%
Phenylalanine
0.343mg
0.331mg
0%
Valine
0.334mg
0.294mg
0%
Histidine
0.167mg
0.145mg
0%
Fructose
0.2g
0.29g
0%
Omega-3 - DHA
0.007g
0g
N/A
Omega-3 - ALA
0.076g
1.485g
N/A
Omega-3 - DPA
0.003g
0g
N/A
Omega-3 - Eicosatrienoic acid
0.004g
0g
N/A
Omega-6 - Gamma-linoleic acid
0.004g
0.062g
N/A
Omega-6 - Dihomo-gamma-linoleic acid
0.009g
0g
N/A
Omega-6 - Eicosadienoic acid
0.043g
0.009g
N/A
Omega-6 - Linoleic acid
1.726g
11.48g
N/A
Macronutrient Comparison
Macronutrient breakdown side-by-side comparison
1
7%
10%
54%
27%
2%
Protein:
6.59 g
Fats:
9.58 g
Carbs:
54.46 g
Water:
27.11 g
Other:
2.26 g
4
7%
26%
61%
3%
2%
Protein:
6.64 g
Fats:
26.43 g
Carbs:
61.3 g
Water:
3.14 g
Other:
2.49 g
Contains
more
Water Water
+763.4%
Contains
more
Fats Fats
+175.9%
Contains
more
Carbs Carbs
+12.6%
Contains
more
Other Other
+10.2%
Fat Type Comparison
Fat type breakdown side-by-side comparison
1
41%
38%
21%
Saturated fat:
Sat. Fat
3.732 g
Monounsaturated fat:
Mono. Fat
3.494 g
Polyunsaturated fat:
Poly. Fat
1.963 g
2
22%
26%
52%
Saturated fat:
Sat. Fat
5.562 g
Monounsaturated fat:
Mono. Fat
6.553 g
Polyunsaturated fat:
Poly. Fat
13.137 g
Contains
less
Sat. Fat Saturated fat
-32.9%
Contains
more
Mono. Fat Monounsaturated fat
+87.6%
Contains
more
Poly. Fat Polyunsaturated fat
+569.2%
Carbohydrate type comparison
Carbohydrate type breakdown side-by-side comparison
2
69%
28%
2%
Starch:
35.66 g
Sucrose:
14.45 g
Glucose:
0.29 g
Fructose:
0.2 g
Lactose:
1.05 g
Maltose:
0.06 g
Galactose:
0 g
4
86%
12%
Starch:
49.69 g
Sucrose:
6.95 g
Glucose:
0.47 g
Fructose:
0.29 g
Lactose:
0 g
Maltose:
0.48 g
Galactose:
0 g
Contains
more
Sucrose Sucrose
+107.9%
Contains
more
Lactose Lactose
+∞%
Contains
more
Starch Starch
+39.3%
Contains
more
Glucose Glucose
+62.1%
Contains
more
Fructose Fructose
+45%
Contains
more
Maltose Maltose
+700%