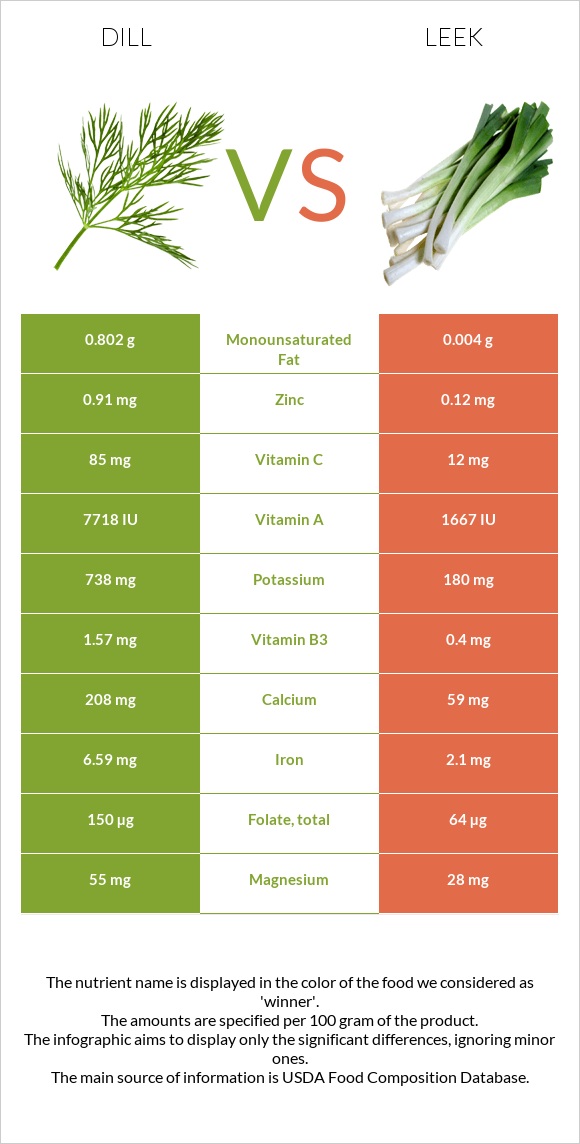
Differences between dill and leeks Leeks contain less vitamin A, vitamin C, iron, manganese, folate, vitamin B2, potassium, calcium, vitamin B3, and zinc than dill. Dill's daily need coverage for vitamin A is 121% higher. Leeks contain 10 times less vitamin B2 than dill. Dill contains 0.296mg of vitamin B2, while leeks contain 0.03mg. Dill has a lower glycemic index. The glycemic index of dill is 15, while the glycemic index of leeks is 32. The food types used in this comparison are Dill weed, fresh and Leeks, (bulb and lower leaf-portion), raw .
Infographic
Mineral Comparison
Mineral comparison score is based on the number of minerals by which one or the other food is richer. The "coverage" charts below show how much of the daily needs can be covered by 300 grams of the food.
8
100 g
300 g
5 sprigs - 1g 1 cup sprigs - 8.9g
Magnesium
Magnesium
Calcium
Calcium
Potassium
Potassium
Iron
Iron
Copper
Copper
Zinc
Zinc
Phosphorus
Phosphorus
Sodium
Sodium
Manganese
Manganese
Selenium
Selenium
39%
62%
65%
247%
49%
25%
28%
8%
165%
0%
2
100 g
300 g
1 slice - 6g 1 cup - 89g 1 leek - 89g
Magnesium
Magnesium
Calcium
Calcium
Potassium
Potassium
Iron
Iron
Copper
Copper
Zinc
Zinc
Phosphorus
Phosphorus
Sodium
Sodium
Manganese
Manganese
Selenium
Selenium
20%
18%
16%
79%
40%
3.3%
15%
2.6%
63%
5.5%
Vitamin Comparison
Vitamin comparison score is based on the number of vitamins by which one or the other food is richer. The "coverage" charts below show how much of the daily needs can be covered by 300 grams of the food.
6
100 g
300 g
5 sprigs - 1g 1 cup sprigs - 8.9g
Vitamin C
Vit. C
Vitamin D
Vit. D
Vitamin A
Vit. A
Vitamin E
Vit. E
Vitamin B1
Vit. B1
Vitamin B2
Vit. B2
Vitamin B3
Vit. B3
Vitamin B5
Vit. B5
Vitamin B6
Vit. B6
Vitamin B12
Vit. B12
Vitamin K
Vit. K
Folate
Folate
283%
0%
129%
0%
15%
68%
29%
24%
43%
0%
0%
113%
3
100 g
300 g
1 slice - 6g 1 cup - 89g 1 leek - 89g
Vitamin C
Vit. C
Vitamin D
Vit. D
Vitamin A
Vit. A
Vitamin E
Vit. E
Vitamin B1
Vit. B1
Vitamin B2
Vit. B2
Vitamin B3
Vit. B3
Vitamin B5
Vit. B5
Vitamin B6
Vit. B6
Vitamin B12
Vit. B12
Vitamin K
Vit. K
Folate
Folate
40%
0%
28%
18%
15%
6.9%
7.5%
8.4%
54%
0%
118%
48%
All nutrients comparison - raw data values
Nutrient
DV% diff.
Vitamin C
85mg
12mg
81%
Iron
6.59mg
2.1mg
56%
Vitamin K
47µg
39%
Vitamin A
386µg
83µg
34%
Manganese
1.264mg
0.481mg
34%
Folate
150µg
64µg
22%
Vitamin B2
0.296mg
0.03mg
20%
Potassium
738mg
180mg
16%
Calcium
208mg
59mg
15%
Zinc
0.91mg
0.12mg
7%
Vitamin B3
1.57mg
0.4mg
7%
Magnesium
55mg
28mg
6%
Vitamin E
0.92mg
6%
Vitamin B5
0.397mg
0.14mg
5%
Protein
3.46g
1.5g
4%
Phosphorus
66mg
35mg
4%
Vitamin B6
0.185mg
0.233mg
4%
Copper
0.146mg
0.12mg
3%
Carbs
7.02g
14.15g
2%
Sodium
61mg
20mg
2%
Selenium
1µg
2%
Choline
9.5mg
2%
Monounsaturated fat
0.802g
0.004g
2%
Calories
43kcal
61kcal
1%
Fats
1.12g
0.3g
1%
Fiber
2.1g
1.8g
1%
Protein per 100 calories
8g
2.5g
N/A
Calories per 10 g protein
124kcal
407kcal
N/A
Weight per 100 calories
233g
164g
N/A
Net carbs
4.92g
12.35g
N/A
Sugar
3.9g
N/A
Vitamin B1
0.058mg
0.06mg
0%
Saturated fat
0.06g
0.04g
0%
Polyunsaturated fat
0.095g
0.166g
0%
Tryptophan
0.014mg
0.012mg
0%
Threonine
0.068mg
0.063mg
0%
Isoleucine
0.195mg
0.052mg
0%
Leucine
0.159mg
0.096mg
0%
Lysine
0.246mg
0.078mg
0%
Methionine
0.011mg
0.018mg
0%
Phenylalanine
0.065mg
0.055mg
0%
Valine
0.154mg
0.056mg
0%
Histidine
0.071mg
0.025mg
0%
Macronutrient Comparison
Macronutrient breakdown side-by-side comparison
4
3%
7%
86%
2%
Protein:
3.46 g
Fats:
1.12 g
Carbs:
7.02 g
Water:
85.95 g
Other:
2.45 g
1
14%
83%
Protein:
1.5 g
Fats:
0.3 g
Carbs:
14.15 g
Water:
83 g
Other:
1.05 g
Contains
more
Protein Protein
+130.7%
Contains
more
Fats Fats
+273.3%
Contains
more
Other Other
+133.3%
Contains
more
Carbs Carbs
+101.6%
Fat Type Comparison
Fat type breakdown side-by-side comparison
1
6%
84%
10%
Saturated fat:
Sat. Fat
0.06 g
Monounsaturated fat:
Mono. Fat
0.802 g
Polyunsaturated fat:
Poly. Fat
0.095 g
2
19%
2%
79%
Saturated fat:
Sat. Fat
0.04 g
Monounsaturated fat:
Mono. Fat
0.004 g
Polyunsaturated fat:
Poly. Fat
0.166 g
Contains
more
Mono. Fat Monounsaturated fat
+19950%
Contains
less
Sat. Fat Saturated fat
-33.3%
Contains
more
Poly. Fat Polyunsaturated fat
+74.7%