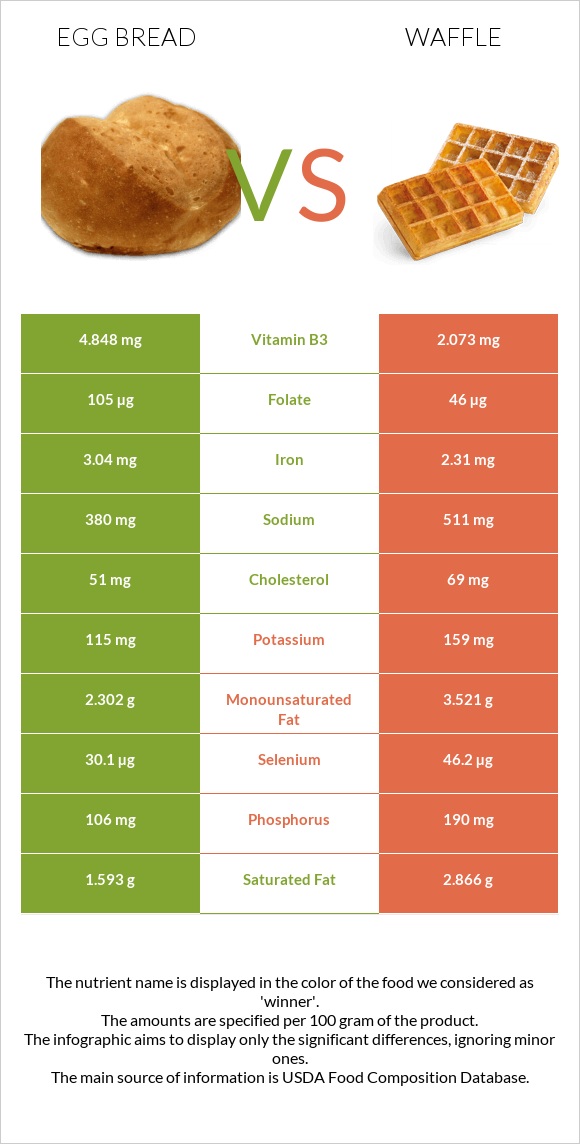
The main differences between egg bread and waffle Egg bread is richer in vitamin B3, folate, vitamin B1, copper, manganese, iron, and vitamin B2, yet waffle is richer in selenium, calcium, and phosphorus. Daily need coverage for selenium for waffle is 29% higher. Egg bread contains 3 times more copper than waffle. Egg bread contains 0.162mg of copper, while waffle contains 0.062mg. Food types used in this article are Bread, egg and Waffles, plain, prepared from recipe .
Infographic
Mineral Comparison
Mineral comparison score is based on the number of minerals by which one or the other food is richer. The "coverage" charts below show how much of the daily needs can be covered by 300 grams of the food.
5
100 g
300 g
1 oz - 28.35g 1 slice (5" x 3" x 1/2") - 40g
Magnesium
Magnesium
Calcium
Calcium
Potassium
Potassium
Iron
Iron
Copper
Copper
Zinc
Zinc
Phosphorus
Phosphorus
Sodium
Sodium
Manganese
Manganese
Selenium
Selenium
14%
28%
10%
114%
54%
22%
45%
50%
65%
164%
4
100 g
300 g
1 oz - 28.35g 1 waffle, round (7" dia) - 75g
Magnesium
Magnesium
Calcium
Calcium
Potassium
Potassium
Iron
Iron
Copper
Copper
Zinc
Zinc
Phosphorus
Phosphorus
Sodium
Sodium
Manganese
Manganese
Selenium
Selenium
14%
77%
14%
87%
21%
19%
81%
67%
35%
252%
Vitamin Comparison
Vitamin comparison score is based on the number of vitamins by which one or the other food is richer. The "coverage" charts below show how much of the daily needs can be covered by 300 grams of the food.
8
100 g
300 g
1 oz - 28.35g 1 slice (5" x 3" x 1/2") - 40g
Vitamin C
Vit. C
Vitamin D
Vit. D
Vitamin A
Vit. A
Vitamin E
Vit. E
Vitamin B1
Vit. B1
Vitamin B2
Vit. B2
Vitamin B3
Vit. B3
Vitamin B5
Vit. B5
Vitamin B6
Vit. B6
Vitamin B12
Vit. B12
Vitamin K
Vit. K
Folate
Folate
0%
6%
21%
5.2%
110%
101%
91%
17%
15%
13%
2.3%
79%
3
100 g
300 g
1 oz - 28.35g 1 waffle, round (7" dia) - 75g
Vitamin C
Vit. C
Vitamin D
Vit. D
Vitamin A
Vit. A
Vitamin E
Vit. E
Vitamin B1
Vit. B1
Vitamin B2
Vit. B2
Vitamin B3
Vit. B3
Vitamin B5
Vit. B5
Vitamin B6
Vit. B6
Vitamin B12
Vit. B12
Vitamin K
Vit. K
Folate
Folate
1.3%
0%
22%
0%
66%
80%
39%
29%
13%
31%
0%
35%
All nutrients comparison - raw data values
Nutrient
DV% diff.
Polyunsaturated fat
1.106g
6.785g
38%
Selenium
30.1µg
46.2µg
29%
Vitamin B3
4.848mg
2.073mg
17%
Calcium
93mg
255mg
16%
Vitamin B1
0.438mg
0.263mg
15%
Folate
105µg
46µg
15%
Choline
84.3mg
15%
Fats
6g
14.1g
12%
Phosphorus
106mg
190mg
12%
Copper
0.162mg
0.062mg
11%
Manganese
0.5mg
0.265mg
10%
Iron
3.04mg
2.31mg
9%
Fiber
2.3g
9%
Vitamin B2
0.436mg
0.347mg
7%
Cholesterol
51mg
69mg
6%
Sodium
380mg
511mg
6%
Vitamin B12
0.1µg
0.25µg
6%
Saturated fat
1.593g
2.866g
6%
Carbs
47.8g
32.9g
5%
Vitamin B5
0.282mg
0.485mg
4%
Protein
9.5g
7.9g
3%
Monounsaturated fat
2.302g
3.521g
3%
Vitamin D*
16 IU
2%
Vitamin D
0.4µg
2%
Vitamin E
0.26mg
2%
Potassium
115mg
159mg
1%
Zinc
0.79mg
0.68mg
1%
Vitamin B6
0.064mg
0.056mg
1%
Vitamin K
0.9µg
1%
Calories
287kcal
291kcal
0%
Protein per 100 calories
3.3g
2.7g
N/A
Calories per 10 g protein
302kcal
368kcal
N/A
Weight per 100 calories
35g
34g
N/A
Unsaturated / Saturated Fat ratio
2.1
3.6
N/A
Vitamin C
0mg
0.4mg
0%
Net carbs
45.5g
32.9g
N/A
Magnesium
19mg
19mg
0%
Sugar
1.78g
N/A
Vitamin A
63µg
65µg
0%
Tryptophan
0.112mg
0.099mg
0%
Threonine
0.306mg
0.289mg
0%
Isoleucine
0.394mg
0.362mg
0%
Leucine
0.692mg
0.63mg
0%
Lysine
0.311mg
0.384mg
0%
Methionine
0.189mg
0.179mg
0%
Phenylalanine
0.475mg
0.395mg
0%
Valine
0.443mg
0.409mg
0%
Histidine
0.21mg
0.187mg
0%
Omega-3 - EPA
0.001g
0.001g
N/A
Omega-3 - DHA
0.012g
0.006g
N/A
Macronutrient Comparison
Macronutrient breakdown side-by-side comparison
2
10%
6%
48%
35%
2%
Protein:
9.5 g
Fats:
6 g
Carbs:
47.8 g
Water:
34.7 g
Other:
2 g
3
8%
14%
33%
42%
3%
Protein:
7.9 g
Fats:
14.1 g
Carbs:
32.9 g
Water:
42 g
Other:
3.1 g
Contains
more
Protein Protein
+20.3%
Contains
more
Carbs Carbs
+45.3%
Contains
more
Fats Fats
+135%
Contains
more
Water Water
+21%
Contains
more
Other Other
+55%
Fat Type Comparison
Fat type breakdown side-by-side comparison
1
32%
46%
22%
Saturated fat:
Sat. Fat
1.593 g
Monounsaturated fat:
Mono. Fat
2.302 g
Polyunsaturated fat:
Poly. Fat
1.106 g
2
22%
27%
52%
Saturated fat:
Sat. Fat
2.866 g
Monounsaturated fat:
Mono. Fat
3.521 g
Polyunsaturated fat:
Poly. Fat
6.785 g
Contains
less
Sat. Fat Saturated fat
-44.4%
Contains
more
Mono. Fat Monounsaturated fat
+53%
Contains
more
Poly. Fat Polyunsaturated fat
+513.5%