Waffle nutrition: calories, carbs, GI, protein, fiber, fats
Waffles, plain, prepared from recipe
*all the values are displayed for the amount of 100 grams

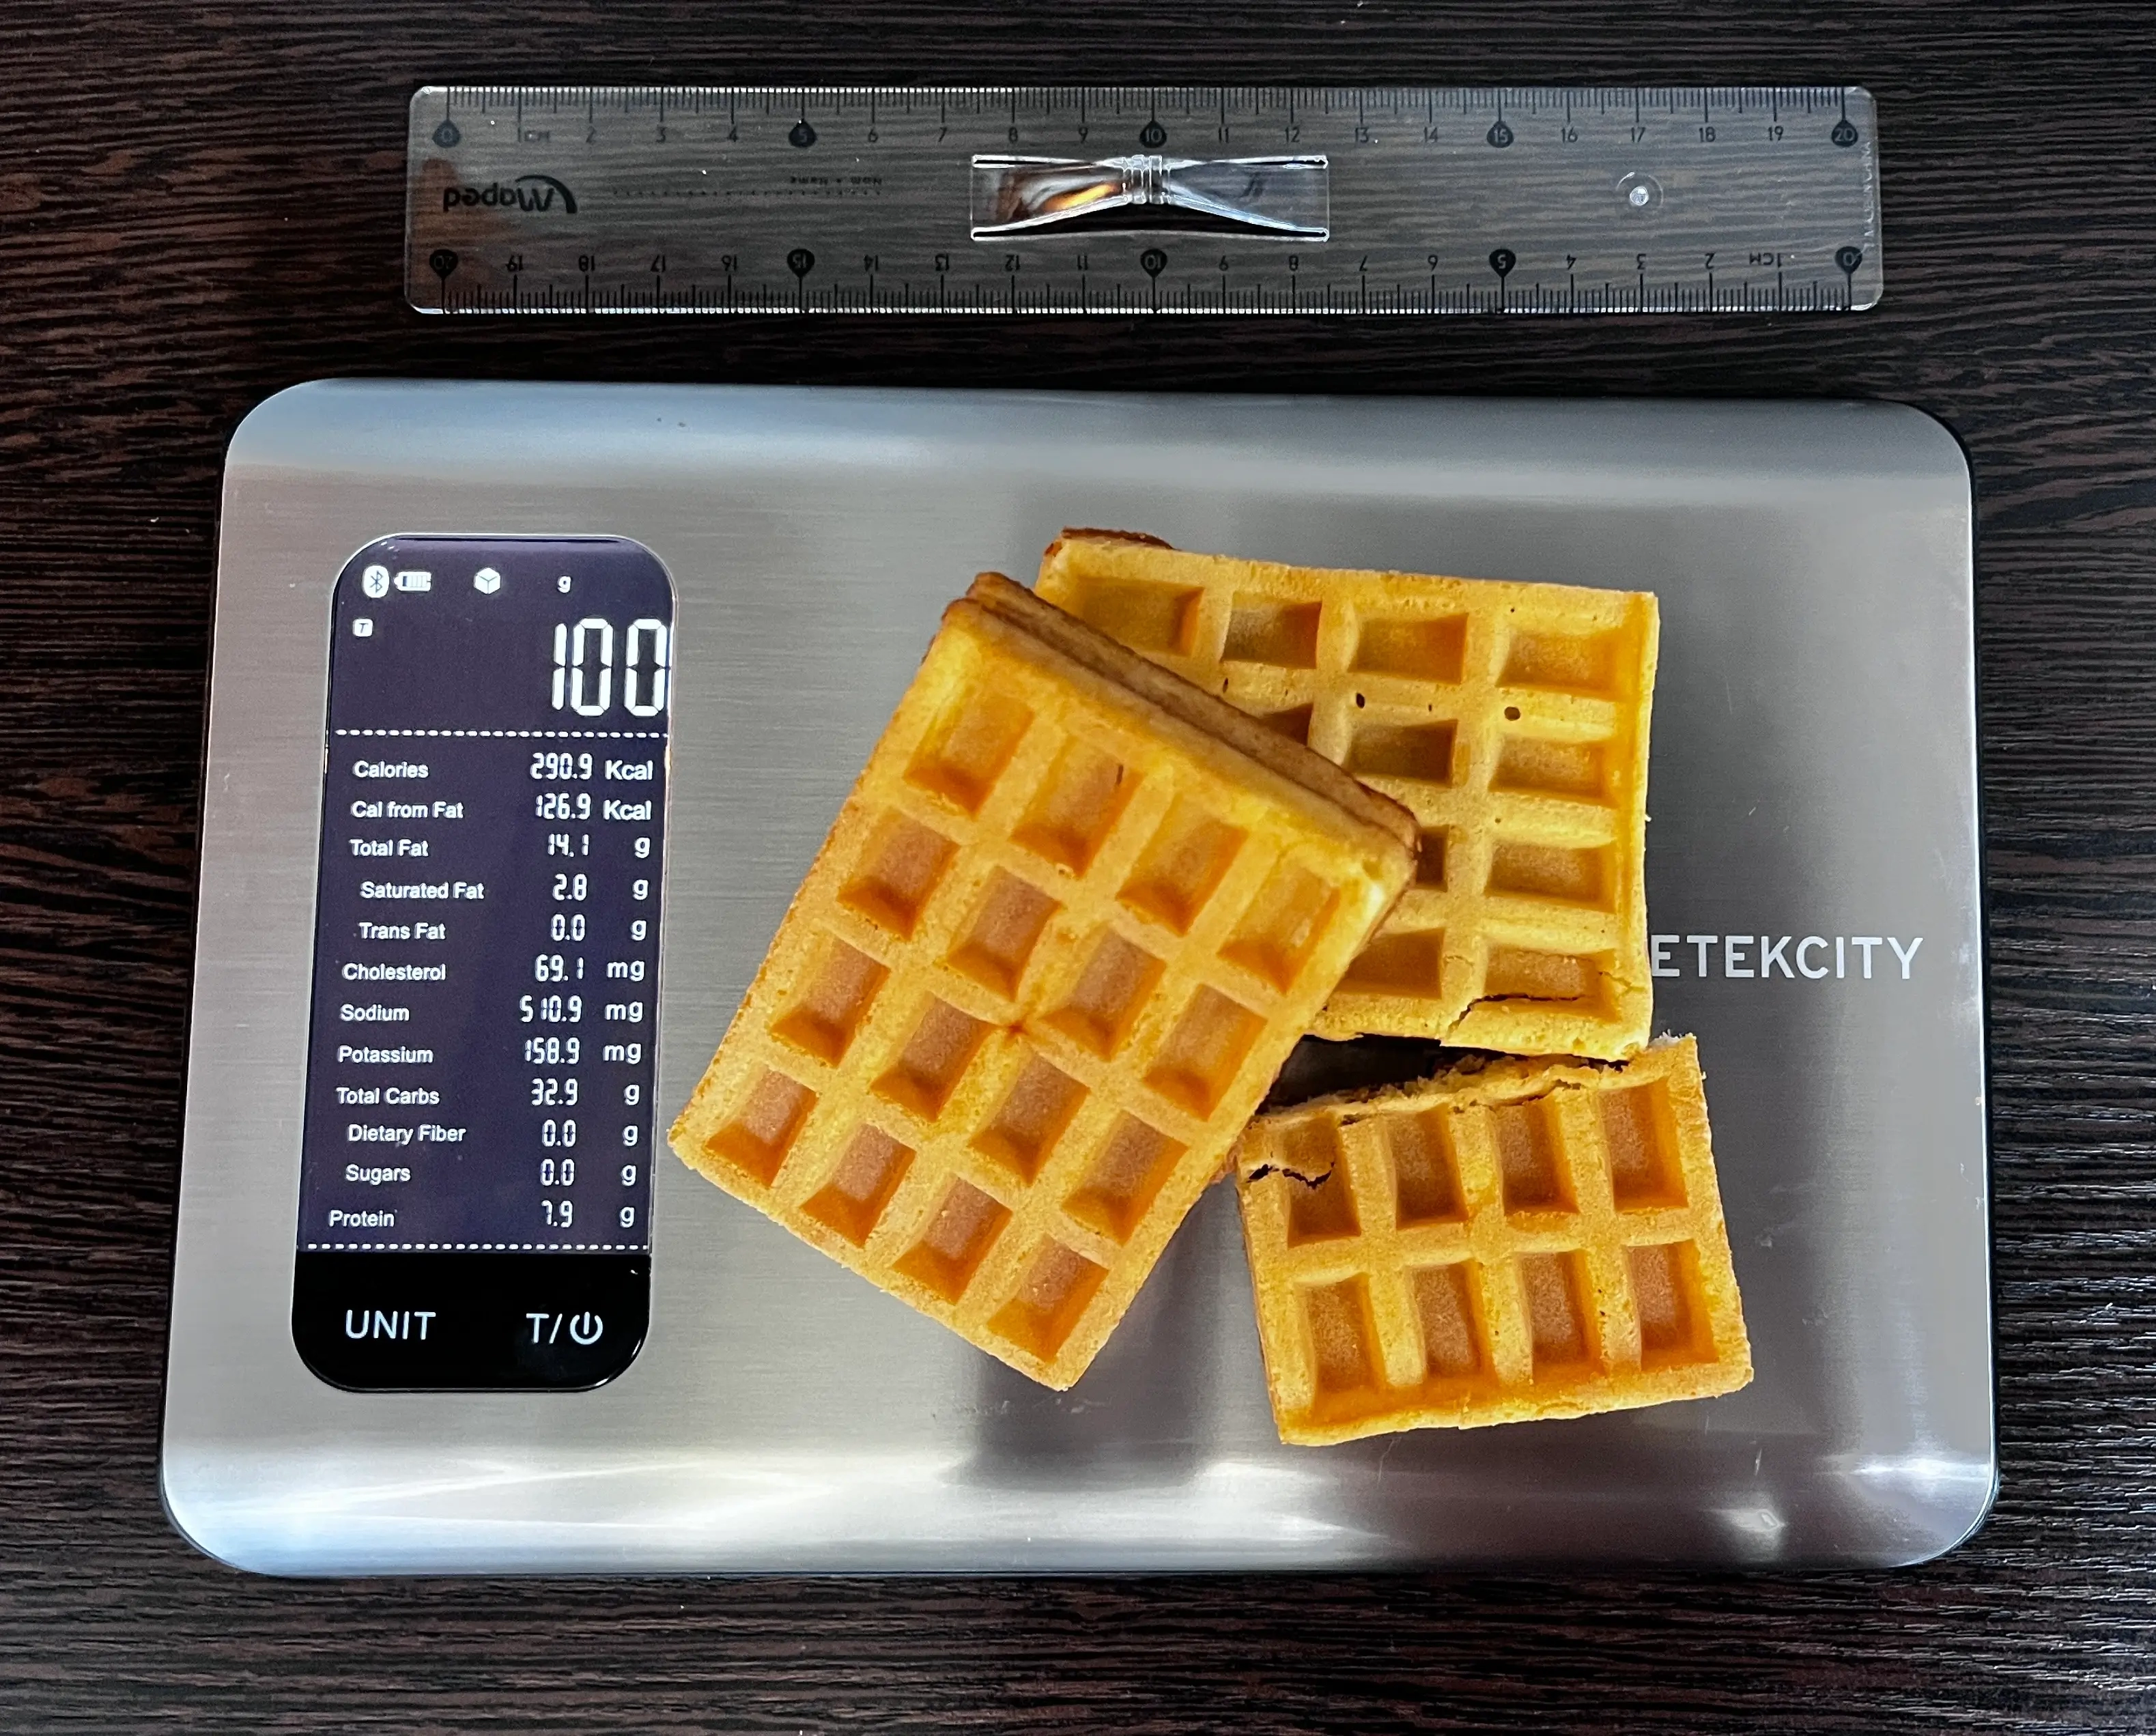
What Do 291 Calories or 100 Grams of Waffles Look Like?
The picture below shows 100 grams of a waffle, which contains 291-292 calories. Waffles are a sweet treat, with most of their calories coming from carbohydrates, along with some fat and protein.
A standard serving is 1 round waffle, about 7 inches in diameter and 75 grams.
Top nutrition facts for Waffle
| Calories ⓘ Calories for selected serving | 291 kcal |
|
Glycemic index ⓘ
Source:
Check out our Glycemic index chart page for the full list.
|
76 (high) |
| Glycemic load ⓘ Glycemic Load (GL) is a metric that measures both the quality (Glycemic Index) and quantity of carbohydrates in a specific serving of food to estimate its impact on blood sugar levels. It is calculated as: (GI × Carbs in grams) / 100. | 19 (medium) |
| Net carbs ⓘ Net Carbs = Total Carbohydrates – Fiber – Sugar Alcohols | 33 g |
| Default serving size ⓘ Serving sizes are mostly taken from FDA's Reference Amounts Customarily Consumed (RACCs) | 1 waffle, round (7" dia) (75 g) |
| Acidity (Based on PRAL) ⓘ PRAL (Potential renal acid load) is calculated using a formula. On the PRAL scale the higher the positive value, the more is the acidifying effect on the body. The lower the negative value, the higher the alkalinity of the food. 0 is neutral. | 3.8 (acidic) |
| Oxalates | 7 mg ⓘ https://pubmed.ncbi.nlm.nih.gov/16608223/ |
Selenium ⓘHigher in Selenium content than 96% of foods
Calcium ⓘHigher in Calcium content than 94% of foods
Polyunsaturated fat ⓘHigher in Polyunsaturated fat content than 92% of foods
Omega-3 - DHA ⓘHigher in Omega-3 - DHA content than 90% of foods
Vitamin A ⓘHigher in Vitamin A content than 86% of foods
Waffle calories (kcal)
| Calories for different serving sizes of waffle | Calories | Weight |
|---|---|---|
| Calories in 100 grams | 291 | |
| Calories in 1 oz | 82 | 28.35 g |
| Calories for different varieties of waffle | Calories | Weight |
|---|---|---|
| Waffles, plain, prepared from recipe (this food) | 291 | 100 g |
| Waffles, whole wheat, lowfat, frozen, ready-to-heat | 257 | 100 g |
| Waffles, gluten-free, frozen, ready-to-heat | 263 | 100 g |
| Waffles, buttermilk, frozen, ready-to-heat | 273 | 100 g |
| Waffles, plain, frozen, ready-to-heat | 285 | 100 g |
| Waffles, chocolate chip, frozen, ready-to-heat | 297 | 100 g |
| Waffles, plain, frozen, ready -to-heat, toasted | 312 | 100 g |
Extra Nutrition facts for Waffle
| Protein per 100 calories ⓘ Shows how many grams of protein you get from 100 calories of this food, calculated as (protein in g ÷ calories) × 100. | 2.7 g |
| Calories per 10 g protein ⓘ Shows how many calories you need to eat from this food to get 10 g of protein, calculated as (calories ÷ protein in g) × 10. | 368 kcal |
| Weight per 100 calories ⓘ Shows how many grams of this food equal 100 kcal—higher grams mean a larger portion for the same calories. | 34 g |
| Unsaturated / Saturated Fat ratio ⓘ (monounsaturated + polyunsaturated) / saturated, ≥2 broadly recommended by major guidelines for heart health | 3.6 |
Waffle Glycemic index (GI)
Source:
Check out our Glycemic index chart page for the full list.
Waffle Glycemic load (GL)
Mineral coverage chart
Mineral chart - relative view
Vitamin coverage chart
Vitamin A:
195µg of 900µg
22%
Vitamin E:
0mg of 15mg
0%
Vitamin D:
0µg of 20µg
0%
Vitamin C:
1.2mg of 90mg
1.3%
Vitamin B1:
0.79mg of 1mg
66%
Vitamin B2:
1mg of 1mg
80%
Vitamin B3:
6.2mg of 16mg
39%
Vitamin B5:
1.5mg of 5mg
29%
Vitamin B6:
0.17mg of 1mg
13%
Folate:
138µg of 400µg
35%
Vitamin B12:
0.75µg of 2µg
31%
Vitamin K:
0µg of 120µg
0%
Vitamin chart - relative view
Macronutrients chart
Protein:
Daily Value: 16%
7.9 g of 50 g
7.9 g (16% of DV )
Fats:
Daily Value: 22%
14.1 g of 65 g
14.1 g (22% of DV )
Carbs:
Daily Value: 11%
32.9 g of 300 g
32.9 g (11% of DV )
Water:
Daily Value: 2%
42 g of 2,000 g
42 g (2% of DV )
Other:
3.1 g
3.1 g
Protein quality breakdown
Tryptophan:
297mg of 280mg
106%
Threonine:
867mg of 1,050mg
83%
Isoleucine:
1086mg of 1,400mg
78%
Leucine:
1890mg of 2,730mg
69%
Lysine:
1152mg of 2,100mg
55%
Methionine:
537mg of 1,050mg
51%
Phenylalanine:
1185mg of 1,750mg
68%
Valine:
1227mg of 1,820mg
67%
Histidine:
561mg of 700mg
80%
Fat type information
Saturated fat:
2.9 g
Monounsaturated fat:
3.5 g
Polyunsaturated fat:
6.8 g
All nutrients for Waffle per 100g
| Nutrient | Value | DV% | In TOP % of foods | Comparison |
| Vitamin A | 65µg | 7% | 14% | |
| Calories | 291kcal | 15% | 31% |
6.2 times more than Orange
|
| Protein per 100 calories | 2.7g | N/A | 63% | |
| Calories per 10 g protein | 368kcal | N/A | 34% | |
| Protein | 7.9g | 19% | 51% |
2.8 times more than Broccoli
|
| Weight per 100 calories | 34g | N/A | 69% | |
| Fats | 14g | 22% | 25% |
2.4 times less than Cheese
|
| Unsaturated / Saturated Fat ratio | 3.6 | N/A | 21% | |
| Vitamin C | 0.4mg | 0% | 40% |
132.5 times less than Lemon
|
| Net carbs | 33g | N/A | 25% |
1.6 times less than Chocolate
|
| Carbs | 33g | 11% | 26% |
1.2 times more than Rice
|
| Cholesterol | 69mg | 23% | 23% |
5.4 times less than Egg
|
| Magnesium | 19mg | 5% | 56% |
7.4 times less than Almonds
|
| Calcium | 255mg | 26% | 6% |
2 times more than Milk
|
| Potassium | 159mg | 5% | 64% |
1.1 times more than Cucumber
|
| Iron | 2.3mg | 29% | 30% |
1.1 times less than Beef broiled
|
| Copper | 0.06mg | 7% | 61% |
2.3 times less than Shiitake
|
| Zinc | 0.68mg | 6% | 54% |
9.3 times less than Beef broiled
|
| Phosphorus | 190mg | 27% | 35% |
Equal to Chicken meat
|
| Sodium | 511mg | 22% | 19% |
Equal to White bread
|
| Selenium | 46µg | 84% | 4% | |
| Manganese | 0.27mg | 12% | 23% | |
| Vitamin B1 | 0.26mg | 22% | 23% |
Equal to Pea raw
|
| Vitamin B2 | 0.35mg | 27% | 15% |
2.7 times more than Avocado
|
| Vitamin B3 | 2.1mg | 13% | 51% |
4.6 times less than Turkey meat
|
| Vitamin B5 | 0.49mg | 10% | 34% |
2.3 times less than Sunflower seeds
|
| Vitamin B6 | 0.06mg | 4% | 66% |
2.1 times less than Oats
|
| Vitamin B12 | 0.25µg | 10% | 44% |
2.8 times less than Pork
|
| Folate | 46µg | 12% | 22% |
1.3 times less than Brussels sprouts
|
| Saturated fat | 2.9g | 14% | 35% |
2.1 times less than Beef broiled
|
| Monounsaturated fat | 3.5g | N/A | 33% |
2.8 times less than Avocado
|
| Polyunsaturated fat | 6.8g | N/A | 8% |
7 times less than Walnut
|
| Tryptophan | 0.1mg | 0% | 37% |
3.1 times less than Chicken meat
|
| Threonine | 0.29mg | 0% | 38% |
2.5 times less than Beef broiled
|
| Isoleucine | 0.36mg | 0% | 37% |
2.5 times less than Salmon raw
|
| Leucine | 0.63mg | 0% | 38% |
3.9 times less than Tuna Bluefin
|
| Lysine | 0.38mg | 0% | 38% |
1.2 times less than Tofu
|
| Methionine | 0.18mg | 0% | 36% |
1.9 times more than Quinoa
|
| Phenylalanine | 0.4mg | 0% | 38% |
1.7 times less than Egg
|
| Valine | 0.41mg | 0% | 38% |
5 times less than Soybean raw
|
| Histidine | 0.19mg | 0% | 39% |
4 times less than Turkey meat
|
| Omega-3 - EPA | 0g | N/A | 20% |
690 times less than Salmon
|
| Omega-3 - DHA | 0.01g | N/A | 10% |
243.3 times less than Salmon
|
| Omega-3 - DPA | 0g | N/A | 100% |
N/A
|
Check out similar food or compare with current

NUTRITION FACTS LABEL
Nutrition Facts
___servings per container
Serving Size ______________
Serving Size ______________
Amount Per 100g
Calories 291
% Daily Value*
22%
Total Fat
14g
13%
Saturated Fat 2.9g
0
Trans Fat
0g
23%
Cholesterol 69mg
22%
Sodium 511mg
11%
Total Carbohydrate
33g
0
Dietary Fiber
0g
Total Sugars 0g
Includes ? g Added Sugars
Protein
7.9g
Vitamin D
0mcg
0
Calcium
255mg
26%
Iron
2.3mg
29%
Potassium
159mg
4.7%
*
The % Daily Value (DV) tells you how much a nutrient in a serving of food contributes to a daily diet. 2,000 calories a day is used for general nutrition advice.
Health checks
ⓘ
Dietary cholesterol is not associated with an increased risk of coronary heart disease in healthy individuals. However, dietary cholesterol is common in foods that are high in harmful saturated fats.
Source
Low in Cholesterol
ⓘ
Trans fat consumption increases the risk of cardiovascular disease and mortality by negatively affecting blood lipid levels.
Source
No Trans Fats
ⓘ
Saturated fat intake can raise total cholesterol and LDL (low-density lipoprotein) levels, leading to an increased risk of atherosclerosis. Dietary guidelines recommend limiting saturated fats to under 10% of calories a day.
Source
Low in Saturated Fats
ⓘ
While the consumption of moderate amounts of added sugars is not detrimental to health, an excessive intake can increase the risk of obesity, and therefore, diabetes.
Source
Low in Sugars
Waffle nutrition infographic
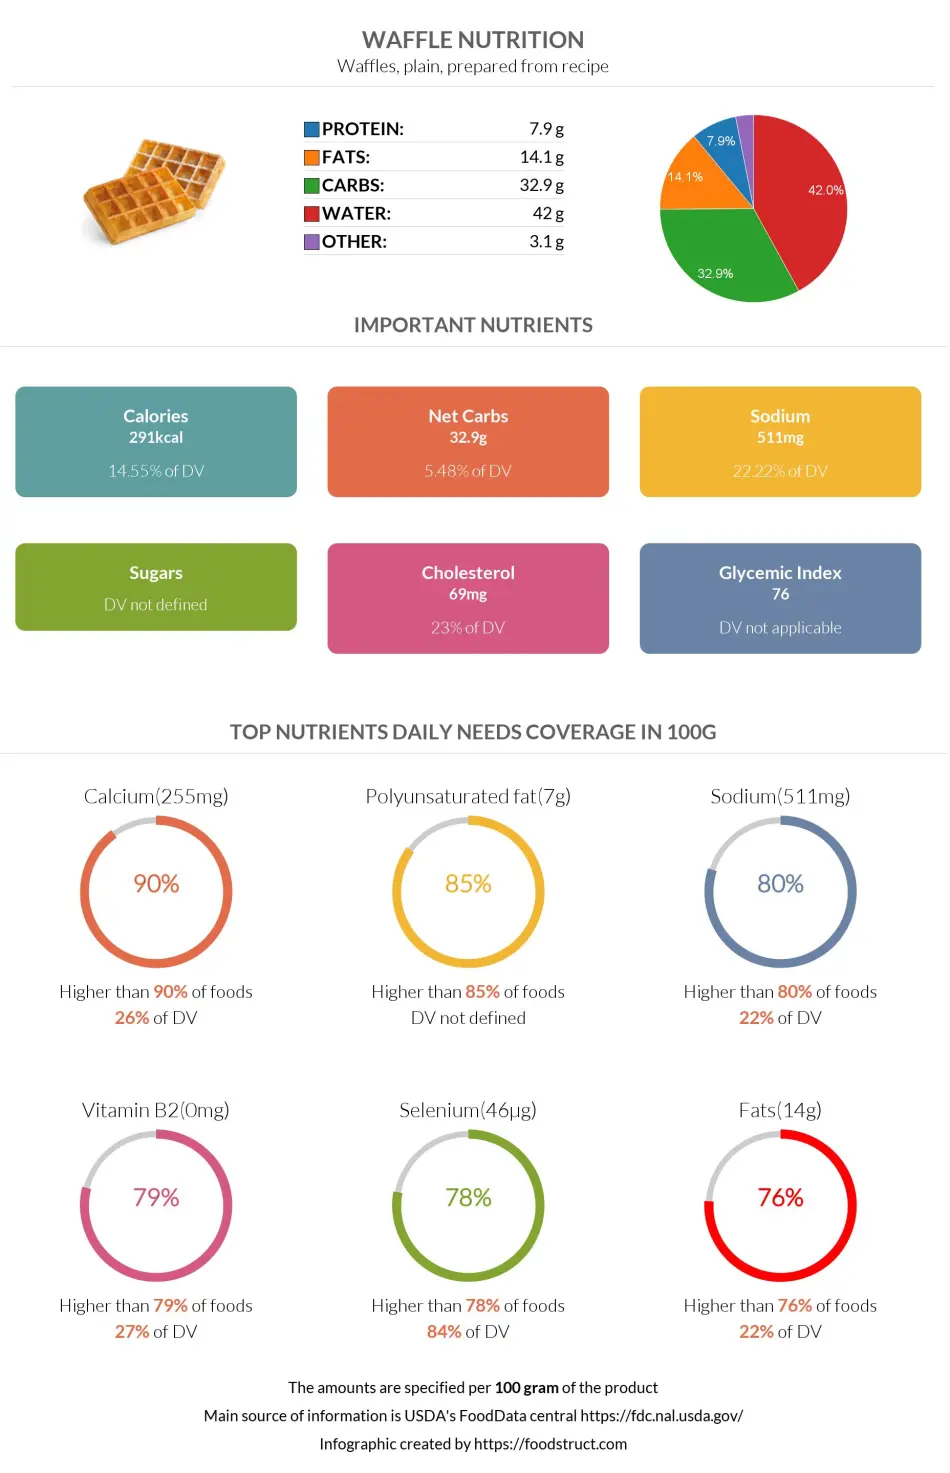
Infographic link
References
All the values for which the sources are not specified explicitly are taken from FDA’s Food Central. The exact link to the food presented on this page can be found below.