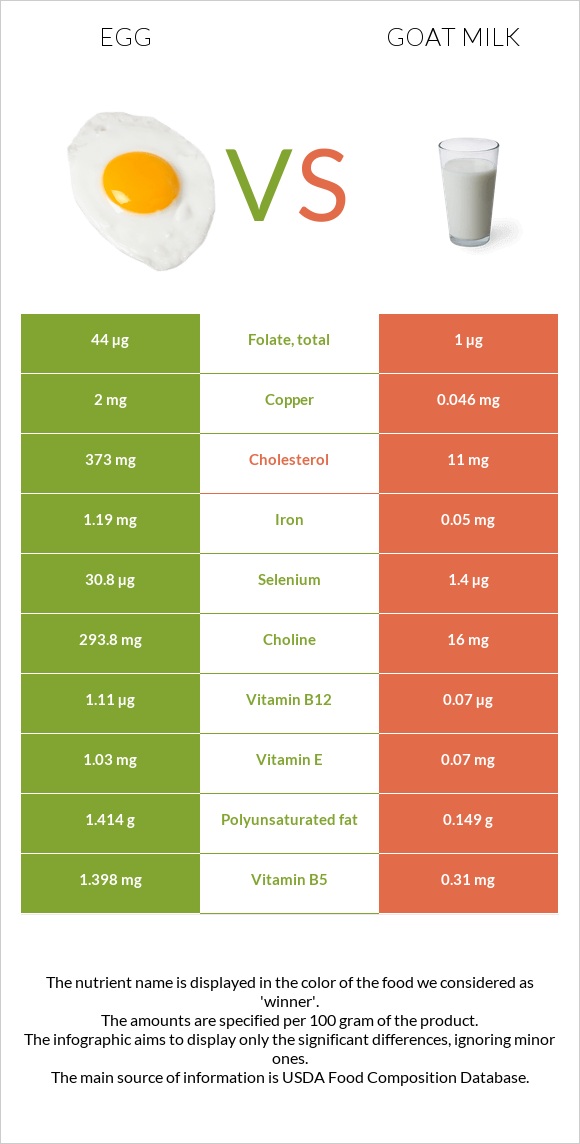
A recap on the differences between eggs and goat milk Eggs are higher than goat milk in copper, selenium, choline, vitamin B12, vitamin B2, vitamin B5, iron, folate, and phosphorus. Eggs cover your daily copper needs 217% more than goat milk. Eggs contain 44 times more folate than goat milk. While eggs contain 44µg of folate, goat milk contains only 1µg. The amount of cholesterol in goat milk is lower. The glycemic index of eggs is lower. Food varieties used in this article are Egg, whole, cooked, hard-boiled and Milk, goat, fluid, with added vitamin D .
Infographic
Mineral Comparison
Mineral comparison score is based on the number of minerals by which one or the other food is richer. The "coverage" charts below show how much of the daily needs can be covered by 300 grams of the food.
6
100 g
300 g
1 tbsp - 8.5g 1 large - 50g 1 cup, chopped - 136g
Magnesium
Magnesium
Calcium
Calcium
Potassium
Potassium
Iron
Iron
Copper
Copper
Zinc
Zinc
Phosphorus
Phosphorus
Sodium
Sodium
Manganese
Manganese
Selenium
Selenium
7.1%
15%
11%
45%
667%
29%
74%
16%
3.4%
168%
4
100 g
300 g
1 fl oz - 30.5g 1 cup - 244g 1 quart - 976g
Magnesium
Magnesium
Calcium
Calcium
Potassium
Potassium
Iron
Iron
Copper
Copper
Zinc
Zinc
Phosphorus
Phosphorus
Sodium
Sodium
Manganese
Manganese
Selenium
Selenium
10%
40%
18%
1.9%
15%
8.2%
48%
6.5%
2.3%
7.6%
Vitamin Comparison
Vitamin comparison score is based on the number of vitamins by which one or the other food is richer. The "coverage" charts below show how much of the daily needs can be covered by 300 grams of the food.
9
100 g
300 g
1 tbsp - 8.5g 1 large - 50g 1 cup, chopped - 136g
Vitamin C
Vit. C
Vitamin D
Vit. D
Vitamin A
Vit. A
Vitamin E
Vit. E
Vitamin B1
Vit. B1
Vitamin B2
Vit. B2
Vitamin B3
Vit. B3
Vitamin B5
Vit. B5
Vitamin B6
Vit. B6
Vitamin B12
Vit. B12
Vitamin K
Vit. K
Folate
Folate
0%
33%
50%
21%
17%
118%
1.2%
84%
28%
139%
0.75%
33%
2
100 g
300 g
1 fl oz - 30.5g 1 cup - 244g 1 quart - 976g
Vitamin C
Vit. C
Vitamin D
Vit. D
Vitamin A
Vit. A
Vitamin E
Vit. E
Vitamin B1
Vit. B1
Vitamin B2
Vit. B2
Vitamin B3
Vit. B3
Vitamin B5
Vit. B5
Vitamin B6
Vit. B6
Vitamin B12
Vit. B12
Vitamin K
Vit. K
Folate
Folate
4.3%
20%
19%
1.4%
12%
32%
5.2%
19%
11%
8.8%
0.75%
0.75%
All nutrients comparison - raw data values
Nutrient
DV% diff.
Copper
2mg
0.046mg
217%
Cholesterol
373mg
11mg
121%
Selenium
30.8µg
1.4µg
53%
Choline
293.8mg
16mg
51%
Vitamin B12
1.11µg
0.07µg
43%
Vitamin B2
0.513mg
0.138mg
29%
Vitamin B5
1.398mg
0.31mg
22%
Protein
12.58g
3.56g
18%
Iron
1.19mg
0.05mg
14%
Folate
44µg
1µg
11%
Fats
10.61g
4.14g
10%
Vitamin A
149µg
57µg
10%
Phosphorus
172mg
111mg
9%
Calcium
50mg
134mg
8%
Polyunsaturated fat
1.414g
0.149g
8%
Zinc
1.05mg
0.3mg
7%
Monounsaturated fat
4.077g
1.109g
7%
Vitamin E
1.03mg
0.07mg
6%
Vitamin B6
0.121mg
0.046mg
6%
Vitamin D*
87 IU
51 IU
5%
Vitamin D
2.2µg
1.3µg
5%
Calories
155kcal
69kcal
4%
Sodium
124mg
50mg
3%
Saturated fat
3.267g
2.667g
3%
Potassium
126mg
204mg
2%
Vitamin B1
0.066mg
0.048mg
2%
Vitamin C
0mg
1.3mg
1%
Carbs
1.12g
4.45g
1%
Magnesium
10mg
14mg
1%
Vitamin B3
0.064mg
0.277mg
1%
Protein per 100 calories
8.1g
5.2g
N/A
Calories per 10 g protein
123kcal
194kcal
N/A
Weight per 100 calories
65g
145g
N/A
Unsaturated / Saturated Fat ratio
1.7
0.47
N/A
Net carbs
1.12g
4.45g
N/A
Sugar
1.12g
4.45g
N/A
Manganese
0.026mg
0.018mg
0%
Vitamin K
0.3µg
0.3µg
0%
Tryptophan
0.153mg
0.044mg
0%
Threonine
0.604mg
0.163mg
0%
Isoleucine
0.686mg
0.207mg
0%
Leucine
1.075mg
0.314mg
0%
Lysine
0.904mg
0.29mg
0%
Methionine
0.392mg
0.08mg
0%
Phenylalanine
0.668mg
0.155mg
0%
Valine
0.767mg
0.24mg
0%
Histidine
0.298mg
0.089mg
0%
Omega-3 - EPA
0.005g
0g
N/A
Omega-3 - DHA
0.038g
0g
N/A
Macronutrient Comparison
Macronutrient breakdown side-by-side comparison
3
13%
11%
75%
Protein:
12.58 g
Fats:
10.61 g
Carbs:
1.12 g
Water:
74.62 g
Other:
1.07 g
2
4%
4%
4%
87%
Protein:
3.56 g
Fats:
4.14 g
Carbs:
4.45 g
Water:
87.03 g
Other:
0.82 g
Contains
more
Protein Protein
+253.4%
Contains
more
Fats Fats
+156.3%
Contains
more
Other Other
+30.5%
Contains
more
Carbs Carbs
+297.3%
Contains
more
Water Water
+16.6%
Fat Type Comparison
Fat type breakdown side-by-side comparison
2
37%
47%
16%
Saturated fat:
Sat. Fat
3.267 g
Monounsaturated fat:
Mono. Fat
4.077 g
Polyunsaturated fat:
Poly. Fat
1.414 g
1
68%
28%
4%
Saturated fat:
Sat. Fat
2.667 g
Monounsaturated fat:
Mono. Fat
1.109 g
Polyunsaturated fat:
Poly. Fat
0.149 g
Contains
more
Mono. Fat Monounsaturated fat
+267.6%
Contains
more
Poly. Fat Polyunsaturated fat
+849%
Contains
less
Sat. Fat Saturated fat
-18.4%