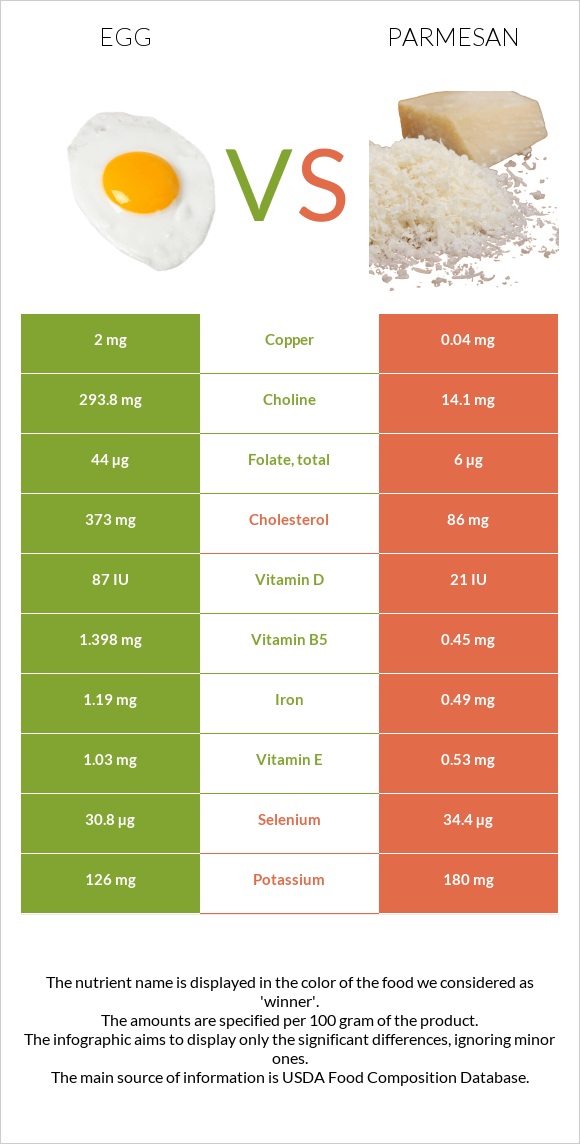
Differences between eggs and parmesan Eggs have more copper, choline, and vitamin B5, while parmesan has more calcium, phosphorus, zinc, and vitamin B12. Eggs' daily need coverage for copper is 218% higher. Parmesan contains 21 times less choline than eggs. Eggs contain 293.8mg of choline, while parmesan contains 14.1mg. The amount of cholesterol in parmesan is lower. The food types used in this comparison are Egg, whole, cooked, hard-boiled and Cheese, parmesan, grated .
Infographic
Mineral Comparison
Mineral comparison score is based on the number of minerals by which one or the other food is richer. The "coverage" charts below show how much of the daily needs can be covered by 300 grams of the food.
3
100 g
300 g
1 tbsp - 8.5g 1 large - 50g 1 cup, chopped - 136g
Magnesium
Magnesium
Calcium
Calcium
Potassium
Potassium
Iron
Iron
Copper
Copper
Zinc
Zinc
Phosphorus
Phosphorus
Sodium
Sodium
Manganese
Manganese
Selenium
Selenium
7.1%
15%
11%
45%
667%
29%
74%
16%
3.4%
168%
7
100 g
300 g
1 tbsp - 5g 1 oz - 28.35g
Magnesium
Magnesium
Calcium
Calcium
Potassium
Potassium
Iron
Iron
Copper
Copper
Zinc
Zinc
Phosphorus
Phosphorus
Sodium
Sodium
Manganese
Manganese
Selenium
Selenium
24%
256%
16%
18%
13%
115%
269%
235%
9.3%
188%
Vitamin Comparison
Vitamin comparison score is based on the number of vitamins by which one or the other food is richer. The "coverage" charts below show how much of the daily needs can be covered by 300 grams of the food.
7
100 g
300 g
1 tbsp - 8.5g 1 large - 50g 1 cup, chopped - 136g
Vitamin C
Vit. C
Vitamin D
Vit. D
Vitamin A
Vit. A
Vitamin E
Vit. E
Vitamin B1
Vit. B1
Vitamin B2
Vit. B2
Vitamin B3
Vit. B3
Vitamin B5
Vit. B5
Vitamin B6
Vit. B6
Vitamin B12
Vit. B12
Vitamin K
Vit. K
Folate
Folate
0%
33%
50%
21%
17%
118%
1.2%
84%
28%
139%
0.75%
33%
4
100 g
300 g
1 tbsp - 5g 1 oz - 28.35g
Vitamin C
Vit. C
Vitamin D
Vit. D
Vitamin A
Vit. A
Vitamin E
Vit. E
Vitamin B1
Vit. B1
Vitamin B2
Vit. B2
Vitamin B3
Vit. B3
Vitamin B5
Vit. B5
Vitamin B6
Vit. B6
Vitamin B12
Vit. B12
Vitamin K
Vit. K
Folate
Folate
0%
7.5%
87%
11%
6.5%
83%
1.5%
27%
19%
175%
4.3%
4.5%
All nutrients comparison - raw data values
Nutrient
DV% diff.
Copper
2mg
0.04mg
218%
Cholesterol
373mg
86mg
96%
Calcium
50mg
853mg
80%
Sodium
124mg
1804mg
73%
Phosphorus
172mg
627mg
65%
Saturated fat
3.267g
15.371g
55%
Choline
293.8mg
14.1mg
51%
Protein
12.58g
28.42g
32%
Zinc
1.05mg
4.2mg
29%
Fats
10.61g
27.84g
27%
Vitamin B5
1.398mg
0.45mg
19%
Calories
155kcal
420kcal
13%
Vitamin A
149µg
262µg
13%
Vitamin B2
0.513mg
0.358mg
12%
Vitamin B12
1.11µg
1.4µg
12%
Folate
44µg
6µg
10%
Vitamin D
2.2µg
0.5µg
9%
Iron
1.19mg
0.49mg
9%
Vitamin D*
87 IU
21 IU
8%
Monounsaturated fat
4.077g
7.13g
8%
Selenium
30.8µg
34.4µg
7%
Magnesium
10mg
34mg
6%
Carbs
1.12g
13.91g
4%
Vitamin E
1.03mg
0.53mg
3%
Vitamin B1
0.066mg
0.026mg
3%
Vitamin B6
0.121mg
0.081mg
3%
Potassium
126mg
180mg
2%
Manganese
0.026mg
0.071mg
2%
Vitamin K
0.3µg
1.7µg
1%
Protein per 100 calories
8.1g
6.8g
N/A
Calories per 10 g protein
123kcal
148kcal
N/A
Weight per 100 calories
65g
24g
N/A
Unsaturated / Saturated Fat ratio
1.7
0.55
N/A
Net carbs
1.12g
13.91g
N/A
Sugar
1.12g
0.07g
N/A
Vitamin B3
0.064mg
0.08mg
0%
Trans fat
0.876g
N/A
Polyunsaturated fat
1.414g
1.386g
0%
Tryptophan
0.153mg
0.383mg
0%
Threonine
0.604mg
1.075mg
0%
Isoleucine
0.686mg
1.455mg
0%
Leucine
1.075mg
2.747mg
0%
Lysine
0.904mg
2.201mg
0%
Methionine
0.392mg
0.751mg
0%
Phenylalanine
0.668mg
1.538mg
0%
Valine
0.767mg
1.865mg
0%
Histidine
0.298mg
0.806mg
0%
Omega-3 - EPA
0.005g
0g
N/A
Omega-3 - DHA
0.038g
0g
N/A
Omega-3 - ALA
0.102g
N/A
Omega-3 - DPA
0g
0.015g
N/A
Omega-3 - Eicosatrienoic acid
0.002g
N/A
Omega-6 - Gamma-linoleic acid
0.002g
N/A
Omega-6 - Dihomo-gamma-linoleic acid
0.026g
N/A
Omega-6 - Eicosadienoic acid
0.006g
N/A
Omega-6 - Linoleic acid
0.87g
N/A
Macronutrient Comparison
Macronutrient breakdown side-by-side comparison
1
13%
11%
75%
Protein:
12.58 g
Fats:
10.61 g
Carbs:
1.12 g
Water:
74.62 g
Other:
1.07 g
4
28%
28%
14%
23%
7%
Protein:
28.42 g
Fats:
27.84 g
Carbs:
13.91 g
Water:
22.65 g
Other:
7.18 g
Contains
more
Water Water
+229.4%
Contains
more
Protein Protein
+125.9%
Contains
more
Fats Fats
+162.4%
Contains
more
Carbs Carbs
+1142%
Contains
more
Other Other
+571%
Fat Type Comparison
Fat type breakdown side-by-side comparison
2
37%
47%
16%
Saturated fat:
Sat. Fat
3.267 g
Monounsaturated fat:
Mono. Fat
4.077 g
Polyunsaturated fat:
Poly. Fat
1.414 g
1
64%
30%
6%
Saturated fat:
Sat. Fat
15.371 g
Monounsaturated fat:
Mono. Fat
7.13 g
Polyunsaturated fat:
Poly. Fat
1.386 g
Contains
less
Sat. Fat Saturated fat
-78.7%
Contains
more
Mono. Fat Monounsaturated fat
+74.9%
~equal in
Polyunsaturated fat
~1.386g