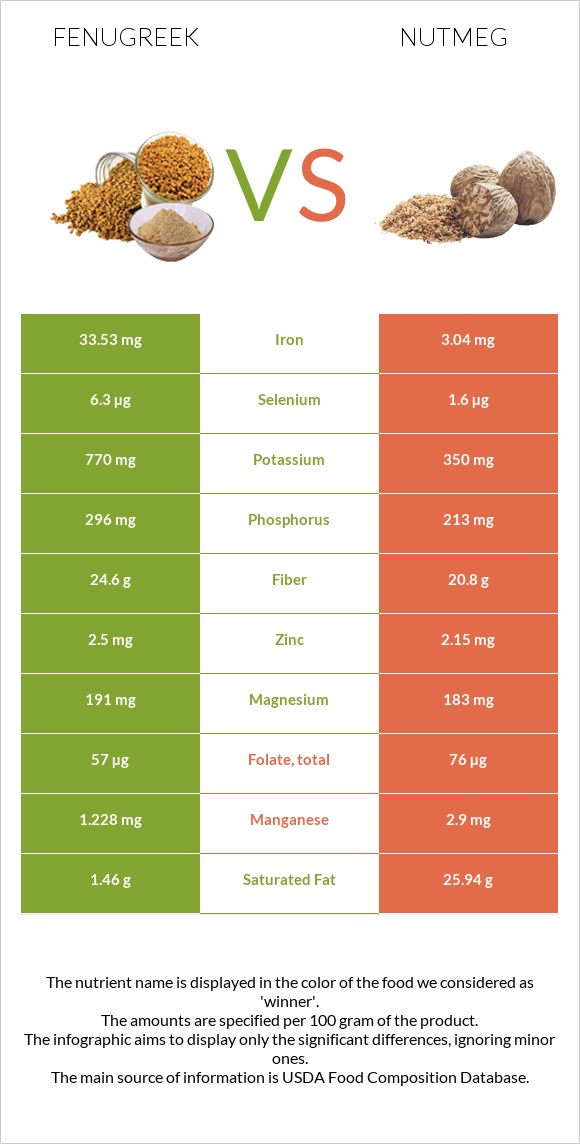
The main differences between fenugreek and nutmeg Fenugreek is richer in iron, vitamin B6, vitamin B2, fiber, potassium, phosphorus, copper, and selenium, yet nutmeg is richer in manganese. Daily need coverage for iron for fenugreek is 381% higher. Fenugreek contains 6 times more vitamin B2 than nutmeg. Fenugreek contains 0.366mg of vitamin B2, while nutmeg contains 0.057mg. Fenugreek contains less saturated fat. Food types used in this article are Spices, fenugreek seed and Spices, nutmeg, ground .
Infographic
Mineral Comparison
Mineral comparison score is based on the number of minerals by which one or the other food is richer. The "coverage" charts below show how much of the daily needs can be covered by 300 grams of the food.
5
100 g
300 g
0.25 tsp - 0.5g 1 tbsp - 11.1g
Magnesium
Magnesium
Calcium
Calcium
Potassium
Potassium
Iron
Iron
Copper
Copper
Zinc
Zinc
Phosphorus
Phosphorus
Sodium
Sodium
Manganese
Manganese
Selenium
Selenium
136%
53%
68%
1257%
370%
68%
127%
8.7%
160%
34%
2
100 g
300 g
0.25 tsp - 0.5g 1 tbsp - 7g
Magnesium
Magnesium
Calcium
Calcium
Potassium
Potassium
Iron
Iron
Copper
Copper
Zinc
Zinc
Phosphorus
Phosphorus
Sodium
Sodium
Manganese
Manganese
Selenium
Selenium
131%
55%
31%
114%
342%
59%
91%
2.1%
378%
8.7%
Vitamin Comparison
Vitamin comparison score is based on the number of vitamins by which one or the other food is richer. The "coverage" charts below show how much of the daily needs can be covered by 300 grams of the food.
3
100 g
300 g
0.25 tsp - 0.5g 1 tbsp - 11.1g
Vitamin C
Vit. C
Vitamin D
Vit. D
Vitamin A
Vit. A
Vitamin E
Vit. E
Vitamin B1
Vit. B1
Vitamin B2
Vit. B2
Vitamin B3
Vit. B3
Vitamin B5
Vit. B5
Vitamin B6
Vit. B6
Vitamin B12
Vit. B12
Vitamin K
Vit. K
Folate
Folate
10%
0%
1%
0%
81%
84%
31%
0%
138%
0%
0%
43%
2
100 g
300 g
0.25 tsp - 0.5g 1 tbsp - 7g
Vitamin C
Vit. C
Vitamin D
Vit. D
Vitamin A
Vit. A
Vitamin E
Vit. E
Vitamin B1
Vit. B1
Vitamin B2
Vit. B2
Vitamin B3
Vit. B3
Vitamin B5
Vit. B5
Vitamin B6
Vit. B6
Vitamin B12
Vit. B12
Vitamin K
Vit. K
Folate
Folate
10%
0%
1.7%
0%
87%
13%
24%
0%
37%
0%
0%
57%
All nutrients comparison - raw data values
Nutrient
DV% diff.
Iron
33.53mg
3.04mg
381%
Saturated fat
1.46g
25.94g
111%
Manganese
1.228mg
2.9mg
73%
Fats
6.41g
36.31g
46%
Protein
23g
5.84g
34%
Vitamin B6
0.6mg
0.16mg
34%
Vitamin B2
0.366mg
0.057mg
24%
Fiber
24.6g
20.8g
15%
Potassium
770mg
350mg
12%
Phosphorus
296mg
213mg
12%
Calories
323kcal
525kcal
10%
Copper
1.11mg
1.027mg
9%
Selenium
6.3µg
1.6µg
9%
Monounsaturated fat
3.22g
8%
Folate
57µg
76µg
5%
Carbs
58.35g
49.29g
3%
Zinc
2.5mg
2.15mg
3%
Magnesium
191mg
183mg
2%
Sodium
67mg
16mg
2%
Vitamin B1
0.322mg
0.346mg
2%
Vitamin B3
1.64mg
1.299mg
2%
Choline
8.8mg
2%
Polyunsaturated fat
0.35g
2%
Calcium
176mg
184mg
1%
Protein per 100 calories
7.1g
1.1g
N/A
Calories per 10 g protein
140kcal
899kcal
N/A
Weight per 100 calories
31g
19g
N/A
Unsaturated / Saturated Fat ratio
0
0.14
N/A
Vitamin C
3mg
3mg
0%
Net carbs
33.75g
28.49g
N/A
Sugar
2.99g
N/A
Vitamin A
3µg
5µg
0%
Tryptophan
0.391mg
0%
Threonine
0.898mg
0%
Isoleucine
1.241mg
0%
Leucine
1.757mg
0%
Lysine
1.684mg
0%
Methionine
0.338mg
0%
Phenylalanine
1.089mg
0%
Valine
1.102mg
0%
Histidine
0.668mg
0%
Macronutrient Comparison
Macronutrient breakdown side-by-side comparison
4
23%
6%
58%
9%
3%
Protein:
23 g
Fats:
6.41 g
Carbs:
58.35 g
Water:
8.84 g
Other:
3.4 g
1
6%
36%
49%
6%
2%
Protein:
5.84 g
Fats:
36.31 g
Carbs:
49.29 g
Water:
6.23 g
Other:
2.33 g
Contains
more
Protein Protein
+293.8%
Contains
more
Carbs Carbs
+18.4%
Contains
more
Water Water
+41.9%
Contains
more
Other Other
+45.9%
Contains
more
Fats Fats
+466.5%
Fat Type Comparison
Fat type breakdown side-by-side comparison
1
100%
Saturated fat:
Sat. Fat
1.46 g
Monounsaturated fat:
Mono. Fat
0 g
Polyunsaturated fat:
Poly. Fat
0 g
2
88%
11%
Saturated fat:
Sat. Fat
25.94 g
Monounsaturated fat:
Mono. Fat
3.22 g
Polyunsaturated fat:
Poly. Fat
0.35 g
Contains
less
Sat. Fat Saturated fat
-94.4%