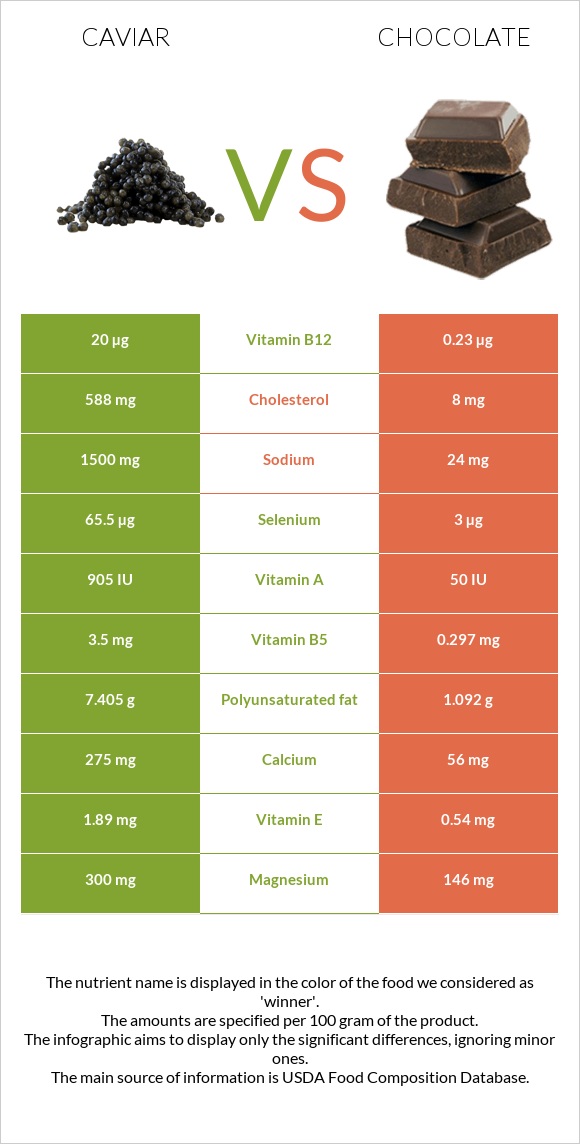
The main differences between caviar and chocolate Caviar has more vitamin B12, selenium, vitamin B5, iron, and vitamin B2; however, chocolate has more copper and manganese. Daily need coverage for vitamin B12 for caviar is 824% higher. Chocolate has 74 times less cholesterol than caviar. Caviar has 588mg of cholesterol, while chocolate has 8mg. Chocolate has a higher glycemic index than caviar. Food types used in this article are Fish, caviar, black, and red, granular and Chocolate, dark, 45- 59% cacao solids .
Infographic
Mineral Comparison
Mineral comparison score is based on the number of minerals by which one or the other food is richer. The "coverage" charts below show how much of the daily needs can be covered by 300 grams of the food.
5
100 g
300 g
1 tbsp - 16g 1 oz - 28.35g
Magnesium
Magnesium
Calcium
Calcium
Potassium
Potassium
Iron
Iron
Copper
Copper
Zinc
Zinc
Phosphorus
Phosphorus
Sodium
Sodium
Manganese
Manganese
Selenium
Selenium
214%
83%
16%
446%
37%
26%
153%
196%
6.5%
357%
5
100 g
300 g
1 oz - 28.35g 1 bar - 162g
Magnesium
Magnesium
Calcium
Calcium
Potassium
Potassium
Iron
Iron
Copper
Copper
Zinc
Zinc
Phosphorus
Phosphorus
Sodium
Sodium
Manganese
Manganese
Selenium
Selenium
104%
17%
49%
301%
343%
55%
88%
3.1%
185%
16%
Vitamin Comparison
Vitamin comparison score is based on the number of vitamins by which one or the other food is richer. The "coverage" charts below show how much of the daily needs can be covered by 300 grams of the food.
9
100 g
300 g
1 tbsp - 16g 1 oz - 28.35g
Vitamin C
Vit. C
Vitamin D
Vit. D
Vitamin A
Vit. A
Vitamin E
Vit. E
Vitamin B1
Vit. B1
Vitamin B2
Vit. B2
Vitamin B3
Vit. B3
Vitamin B5
Vit. B5
Vitamin B6
Vit. B6
Vitamin B12
Vit. B12
Vitamin K
Vit. K
Folate
Folate
0%
44%
90%
38%
48%
143%
2.3%
210%
74%
2500%
1.5%
38%
2
100 g
300 g
1 oz - 28.35g 1 bar - 162g
Vitamin C
Vit. C
Vitamin D
Vit. D
Vitamin A
Vit. A
Vitamin E
Vit. E
Vitamin B1
Vit. B1
Vitamin B2
Vit. B2
Vitamin B3
Vit. B3
Vitamin B5
Vit. B5
Vitamin B6
Vit. B6
Vitamin B12
Vit. B12
Vitamin K
Vit. K
Folate
Folate
0%
0%
0.67%
11%
6.3%
12%
14%
18%
9.7%
29%
20%
0%
All nutrients comparison - raw data values
Nutrient
DV% diff.
Vitamin B12
20µg
0.23µg
824%
Cholesterol
588mg
8mg
193%
Selenium
65.5µg
3µg
114%
Copper
0.11mg
1.028mg
102%
Choline
490.9mg
89%
Saturated fat
4.06g
18.519g
66%
Sodium
1500mg
24mg
64%
Vitamin B5
3.5mg
0.297mg
64%
Manganese
0.05mg
1.419mg
60%
Iron
11.88mg
8.02mg
48%
Vitamin B2
0.62mg
0.05mg
44%
Polyunsaturated fat
7.405g
1.092g
42%
Protein
24.6g
4.88g
39%
Magnesium
300mg
146mg
37%
Vitamin A
271µg
2µg
30%
Fiber
0g
7g
28%
Calcium
275mg
56mg
22%
Fats
17.9g
31.28g
21%
Phosphorus
356mg
206mg
21%
Vitamin B6
0.32mg
0.042mg
21%
Carbs
4g
61.17g
19%
Vitamin D*
117 IU
15%
Vitamin D
2.9µg
15%
Calories
264kcal
546kcal
14%
Vitamin B1
0.19mg
0.025mg
14%
Folate
50µg
13%
Monounsaturated fat
4.631g
9.54g
12%
Potassium
181mg
559mg
11%
Caffeine
0mg
43mg
11%
Zinc
0.95mg
2.01mg
10%
Vitamin E
1.89mg
0.54mg
9%
Vitamin K
0.6µg
8.1µg
6%
Vitamin B3
0.12mg
0.725mg
4%
Protein per 100 calories
9.3g
0.89g
N/A
Calories per 10 g protein
107kcal
1119kcal
N/A
Weight per 100 calories
38g
18g
N/A
Unsaturated / Saturated Fat ratio
3
0.57
N/A
Net carbs
4g
54.17g
N/A
Sugar
0g
47.9g
N/A
Trans fat
0.112g
N/A
Tryptophan
0.323mg
0%
Threonine
1.263mg
0%
Isoleucine
1.035mg
0%
Leucine
2.133mg
0%
Lysine
1.834mg
0%
Methionine
0.646mg
0%
Phenylalanine
1.071mg
0%
Valine
1.263mg
0%
Histidine
0.649mg
0%
Omega-3 - EPA
2.741g
0.001g
N/A
Omega-3 - DHA
3.8g
0g
N/A
Omega-3 - ALA
0.085g
N/A
Omega-3 - DPA
0.229g
0g
N/A
Omega-6 - Eicosadienoic acid
0.001g
N/A
Omega-6 - Linoleic acid
0.947g
N/A
Macronutrient Comparison
Macronutrient breakdown side-by-side comparison
3
25%
18%
4%
48%
6%
Protein:
24.6 g
Fats:
17.9 g
Carbs:
4 g
Water:
47.5 g
Other:
6 g
2
5%
31%
61%
2%
Protein:
4.88 g
Fats:
31.28 g
Carbs:
61.17 g
Water:
0.97 g
Other:
1.7 g
Contains
more
Protein Protein
+404.1%
Contains
more
Water Water
+4796.9%
Contains
more
Other Other
+252.9%
Contains
more
Fats Fats
+74.7%
Contains
more
Carbs Carbs
+1429.3%
Fat Type Comparison
Fat type breakdown side-by-side comparison
2
25%
29%
46%
Saturated fat:
Sat. Fat
4.06 g
Monounsaturated fat:
Mono. Fat
4.631 g
Polyunsaturated fat:
Poly. Fat
7.405 g
1
64%
33%
4%
Saturated fat:
Sat. Fat
18.519 g
Monounsaturated fat:
Mono. Fat
9.54 g
Polyunsaturated fat:
Poly. Fat
1.092 g
Contains
less
Sat. Fat Saturated fat
-78.1%
Contains
more
Poly. Fat Polyunsaturated fat
+578.1%
Contains
more
Mono. Fat Monounsaturated fat
+106%