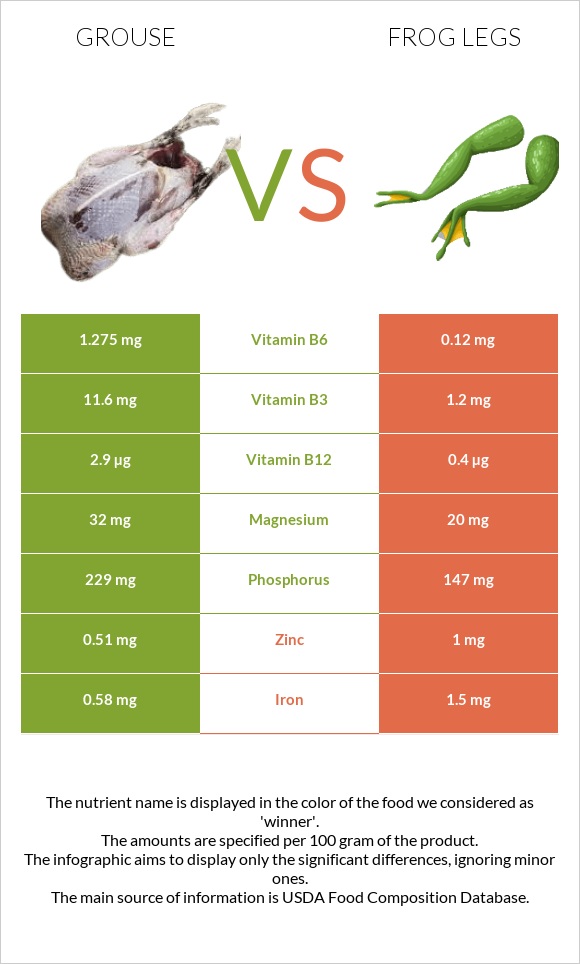
Summary of differences between grouse and frog legs Grouse has more vitamin B12, vitamin B6, vitamin B3, and phosphorus, while frog legs have more copper, iron, and vitamin B1. Grouse covers your daily need for vitamin B12, 104% more than frog legs. Grouse contains 11 times more vitamin B6 than frog legs. While grouse contains 1.275mg of vitamin B6, frog legs contain only 0.12mg. These are the specific foods used in this comparison Ruffed Grouse, breast meat, skinless, raw and Frog legs, raw .
Infographic
Mineral Comparison
Mineral comparison score is based on the number of minerals by which one or the other food is richer. The "coverage" charts below show how much of the daily needs can be covered by 300 grams of the food.
4
100 g
300 g
4 oz - 113g 1 breast - 219g 1 bird - 627g
Magnesium
Magnesium
Calcium
Calcium
Potassium
Potassium
Iron
Iron
Copper
Copper
Zinc
Zinc
Phosphorus
Phosphorus
Sodium
Sodium
Manganese
Manganese
Selenium
Selenium
23%
1.5%
27%
22%
19%
14%
98%
6.5%
2.1%
0%
5
100 g
300 g
1 leg - 45g
Magnesium
Magnesium
Calcium
Calcium
Potassium
Potassium
Iron
Iron
Copper
Copper
Zinc
Zinc
Phosphorus
Phosphorus
Sodium
Sodium
Manganese
Manganese
Selenium
Selenium
14%
5.4%
25%
56%
83%
27%
63%
7.6%
0%
77%
Vitamin Comparison
Vitamin comparison score is based on the number of vitamins by which one or the other food is richer. The "coverage" charts below show how much of the daily needs can be covered by 300 grams of the food.
4
100 g
300 g
4 oz - 113g 1 breast - 219g 1 bird - 627g
Vitamin C
Vit. C
Vitamin D
Vit. D
Vitamin A
Vit. A
Vitamin E
Vit. E
Vitamin B1
Vit. B1
Vitamin B2
Vit. B2
Vitamin B3
Vit. B3
Vitamin B5
Vit. B5
Vitamin B6
Vit. B6
Vitamin B12
Vit. B12
Vitamin K
Vit. K
Folate
Folate
0%
0%
1.7%
15%
11%
65%
218%
0%
294%
363%
0%
0%
6
100 g
300 g
1 leg - 45g
Vitamin C
Vit. C
Vitamin D
Vit. D
Vitamin A
Vit. A
Vitamin E
Vit. E
Vitamin B1
Vit. B1
Vitamin B2
Vit. B2
Vitamin B3
Vit. B3
Vitamin B5
Vit. B5
Vitamin B6
Vit. B6
Vitamin B12
Vit. B12
Vitamin K
Vit. K
Folate
Folate
0%
3%
5%
20%
35%
58%
23%
0%
28%
50%
0.25%
11%
All nutrients comparison - raw data values
Nutrient
DV% diff.
Vitamin B12
2.9µg
0.4µg
104%
Vitamin B6
1.275mg
0.12mg
89%
Vitamin B3
11.6mg
1.2mg
65%
Selenium
14.1µg
26%
Copper
0.058mg
0.25mg
21%
Protein
25.94g
16.4g
19%
Iron
0.58mg
1.5mg
12%
Phosphorus
229mg
147mg
12%
Choline
65mg
12%
Vitamin B1
0.042mg
0.14mg
8%
Zinc
0.51mg
1mg
4%
Folate
15µg
4%
Cholesterol
40mg
50mg
3%
Magnesium
32mg
20mg
3%
Calories
112kcal
73kcal
2%
Vitamin E
0.73mg
1mg
2%
Vitamin B2
0.28mg
0.25mg
2%
Fats
0.88g
0.3g
1%
Vitamin D*
8 IU
1%
Vitamin D
0.2µg
1%
Calcium
5mg
18mg
1%
Potassium
311mg
285mg
1%
Vitamin A
5µg
15µg
1%
Manganese
0.016mg
1%
Protein per 100 calories
23g
22g
N/A
Calories per 10 g protein
43kcal
45kcal
N/A
Weight per 100 calories
89g
137g
N/A
Sodium
50mg
58mg
0%
Vitamin K
0.1µg
0%
Saturated fat
0.13g
0.076g
0%
Monounsaturated fat
0.042g
0.053g
0%
Polyunsaturated fat
0.132g
0.102g
0%
Omega-3 - EPA
0.003g
0.014g
N/A
Omega-3 - DHA
0.009g
0.02g
N/A
Omega-3 - ALA
0.008g
N/A
Omega-3 - DPA
0.008g
0.007g
N/A
Omega-6 - Dihomo-gamma-linoleic acid
0.001g
N/A
Omega-6 - Eicosadienoic acid
0.001g
N/A
Omega-6 - Linoleic acid
0.071g
N/A
Macronutrient Comparison
Macronutrient breakdown side-by-side comparison
2
26%
73%
Protein:
25.94 g
Fats:
0.88 g
Carbs:
0 g
Water:
72.93 g
Other:
0.25 g
2
16%
82%
Protein:
16.4 g
Fats:
0.3 g
Carbs:
0 g
Water:
81.9 g
Other:
1.4 g
Contains
more
Protein Protein
+58.2%
Contains
more
Fats Fats
+193.3%
Contains
more
Water Water
+12.3%
Contains
more
Other Other
+460%
Fat Type Comparison
Fat type breakdown side-by-side comparison
1
43%
14%
43%
Saturated fat:
Sat. Fat
0.13 g
Monounsaturated fat:
Mono. Fat
0.042 g
Polyunsaturated fat:
Poly. Fat
0.132 g
2
33%
23%
44%
Saturated fat:
Sat. Fat
0.076 g
Monounsaturated fat:
Mono. Fat
0.053 g
Polyunsaturated fat:
Poly. Fat
0.102 g
Contains
more
Poly. Fat Polyunsaturated fat
+29.4%
Contains
less
Sat. Fat Saturated fat
-41.5%
Contains
more
Mono. Fat Monounsaturated fat
+26.2%