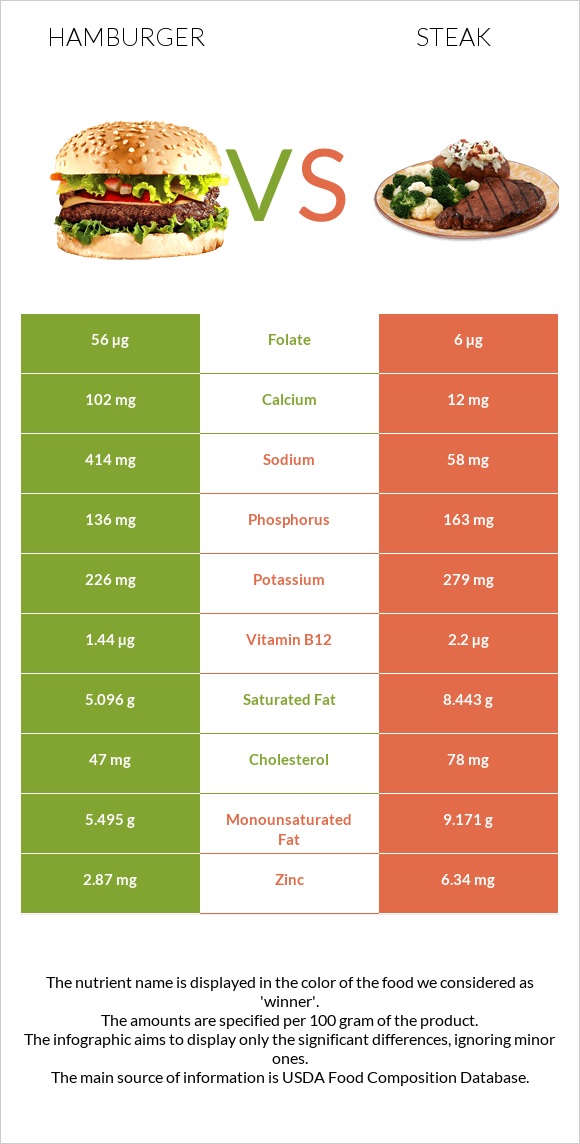
What are the differences between hamburgers and steak? Hamburgers are higher in folate, vitamin B1, calcium, and iron, yet steak is higher in vitamin B12, zinc, and vitamin B6. Steak's daily need coverage for vitamin B12 is 32% more. Hamburgers have 9 times more folate than steak. While hamburgers have 56µg of folate, steak has only 6µg. The amount of sodium in steak is lower. The glycemic index of steak is lower. We used Fast foods, hamburger; double, regular, patty; plain and Beef, rib eye steak, boneless, lip off, separable lean, and fat, trimmed to 0" fat, all grades, cooked, grilled types in this article.
Infographic
Mineral Comparison
Mineral comparison score is based on the number of minerals by which one or the other food is richer. The "coverage" charts below show how much of the daily needs can be covered by 300 grams of the food.
3
100 g
300 g
1 item - 120g
Magnesium
Magnesium
Calcium
Calcium
Potassium
Potassium
Iron
Iron
Copper
Copper
Zinc
Zinc
Phosphorus
Phosphorus
Sodium
Sodium
Manganese
Manganese
Selenium
Selenium
14%
31%
20%
108%
30%
78%
58%
54%
28%
0%
6
100 g
300 g
3 oz - 85g 1 steak - 251g
Magnesium
Magnesium
Calcium
Calcium
Potassium
Potassium
Iron
Iron
Copper
Copper
Zinc
Zinc
Phosphorus
Phosphorus
Sodium
Sodium
Manganese
Manganese
Selenium
Selenium
16%
3.6%
25%
90%
28%
173%
70%
7.6%
0%
173%
Vitamin Comparison
Vitamin comparison score is based on the number of vitamins by which one or the other food is richer. The "coverage" charts below show how much of the daily needs can be covered by 300 grams of the food.
3
100 g
300 g
1 item - 120g
Vitamin C
Vit. C
Vitamin D
Vit. D
Vitamin A
Vit. A
Vitamin E
Vit. E
Vitamin B1
Vit. B1
Vitamin B2
Vit. B2
Vitamin B3
Vit. B3
Vitamin B5
Vit. B5
Vitamin B6
Vit. B6
Vitamin B12
Vit. B12
Vitamin K
Vit. K
Folate
Folate
0%
0%
0%
0%
54%
58%
101%
19%
47%
180%
0%
42%
6
100 g
300 g
3 oz - 85g 1 steak - 251g
Vitamin C
Vit. C
Vitamin D
Vit. D
Vitamin A
Vit. A
Vitamin E
Vit. E
Vitamin B1
Vit. B1
Vitamin B2
Vit. B2
Vitamin B3
Vit. B3
Vitamin B5
Vit. B5
Vitamin B6
Vit. B6
Vitamin B12
Vit. B12
Vitamin K
Vit. K
Folate
Folate
0%
1.5%
2.3%
0%
19%
69%
97%
0%
115%
275%
4%
4.5%
All nutrients comparison - raw data values
Nutrient
DV% diff.
Selenium
31.8µg
58%
Zinc
2.87mg
6.34mg
32%
Vitamin B12
1.44µg
2.2µg
32%
Vitamin B6
0.203mg
0.5mg
23%
Protein
17.08g
24.85g
16%
Sodium
414mg
58mg
15%
Saturated fat
5.096g
8.443g
15%
Folate
56µg
6µg
13%
Vitamin B1
0.217mg
0.074mg
12%
Cholesterol
47mg
78mg
10%
Calcium
102mg
12mg
9%
Manganese
0.217mg
9%
Monounsaturated fat
5.495g
9.171g
9%
Carbs
24.1g
0g
8%
Fats
14.36g
19.02g
7%
Iron
2.88mg
2.4mg
6%
Vitamin B5
0.31mg
6%
Fiber
0.9g
0g
4%
Phosphorus
136mg
163mg
4%
Vitamin B2
0.25mg
0.301mg
4%
Polyunsaturated fat
0.38g
0.896g
3%
Fructose
2.03g
3%
Potassium
226mg
279mg
2%
Calories
295kcal
271kcal
1%
Vitamin D*
6 IU
1%
Vitamin D
0.1µg
1%
Magnesium
20mg
23mg
1%
Copper
0.091mg
0.085mg
1%
Vitamin A
0µg
7µg
1%
Vitamin B3
5.365mg
5.149mg
1%
Vitamin K
1.6µg
1%
Protein per 100 calories
5.8g
9.2g
N/A
Calories per 10 g protein
173kcal
109kcal
N/A
Weight per 100 calories
34g
37g
N/A
Unsaturated / Saturated Fat ratio
1.2
1.2
N/A
Net carbs
23.2g
0g
N/A
Sugar
4.15g
0g
N/A
Trans fat
0.814g
N/A
Tryptophan
0.206mg
0.278mg
0%
Threonine
0.666mg
1.171mg
0%
Isoleucine
0.716mg
1.157mg
0%
Leucine
1.319mg
2.142mg
0%
Lysine
1.226mg
2.38mg
0%
Methionine
0.37mg
0.672mg
0%
Phenylalanine
0.677mg
0.997mg
0%
Valine
0.823mg
1.242mg
0%
Histidine
0.505mg
0.931mg
0%
Omega-3 - EPA
0.001g
N/A
Omega-3 - DHA
0.001g
N/A
Omega-3 - DPA
0.013g
N/A
Macronutrient Comparison
Macronutrient breakdown side-by-side comparison
2
17%
14%
24%
43%
2%
Protein:
17.08 g
Fats:
14.36 g
Carbs:
24.1 g
Water:
42.67 g
Other:
1.79 g
3
25%
19%
56%
Protein:
24.85 g
Fats:
19.02 g
Carbs:
0 g
Water:
55.59 g
Other:
0.54 g
Contains
more
Carbs Carbs
+∞%
Contains
more
Other Other
+231.5%
Contains
more
Protein Protein
+45.5%
Contains
more
Fats Fats
+32.5%
Contains
more
Water Water
+30.3%
Fat Type Comparison
Fat type breakdown side-by-side comparison
1
46%
50%
3%
Saturated fat:
Sat. Fat
5.096 g
Monounsaturated fat:
Mono. Fat
5.495 g
Polyunsaturated fat:
Poly. Fat
0.38 g
2
46%
50%
5%
Saturated fat:
Sat. Fat
8.443 g
Monounsaturated fat:
Mono. Fat
9.171 g
Polyunsaturated fat:
Poly. Fat
0.896 g
Contains
less
Sat. Fat Saturated fat
-39.6%
Contains
more
Mono. Fat Monounsaturated fat
+66.9%
Contains
more
Poly. Fat Polyunsaturated fat
+135.8%