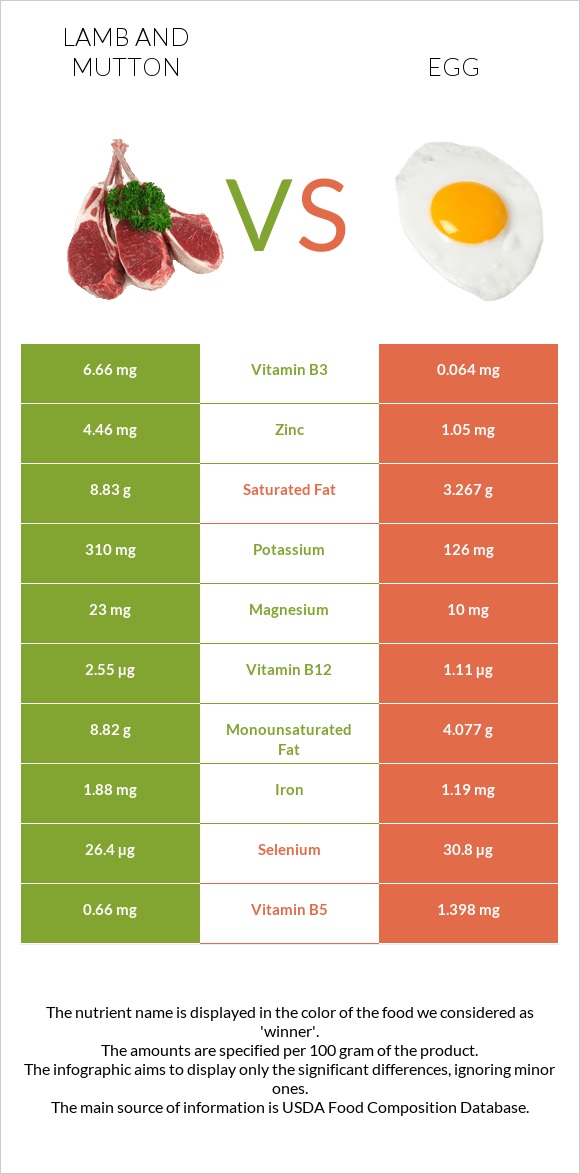
Differences between lamb and eggs Lamb has more vitamin B12, vitamin B3, and zinc, while eggs have more copper, choline, vitamin B2, vitamin B5, and vitamin D*. Eggs' daily need coverage for copper is 209% higher. Eggs contain 104 times less vitamin B3 than lamb. Lamb contains 6.66mg of vitamin B3, while eggs contain 0.064mg. The amount of saturated fat in eggs is lower. The food types used in this comparison are Lamb, domestic, composite of trimmed retail cuts, separable lean, and fat, trimmed to 1/4" fat, choice, cooked and Egg, whole, cooked, hard-boiled .
Infographic
Mineral Comparison
Mineral comparison score is based on the number of minerals by which one or the other food is richer. The "coverage" charts below show how much of the daily needs can be covered by 300 grams of the food.
5
100 g
300 g
3 oz - 85g 1 piece, cooked, excluding refuse (yield from 1 lb raw meat with refuse) - 242g
Magnesium
Magnesium
Calcium
Calcium
Potassium
Potassium
Iron
Iron
Copper
Copper
Zinc
Zinc
Phosphorus
Phosphorus
Sodium
Sodium
Manganese
Manganese
Selenium
Selenium
16%
5.1%
27%
71%
40%
122%
81%
9.4%
2.9%
144%
4
100 g
300 g
1 tbsp - 8.5g 1 large - 50g 1 cup, chopped - 136g
Magnesium
Magnesium
Calcium
Calcium
Potassium
Potassium
Iron
Iron
Copper
Copper
Zinc
Zinc
Phosphorus
Phosphorus
Sodium
Sodium
Manganese
Manganese
Selenium
Selenium
7.1%
15%
11%
45%
667%
29%
74%
16%
3.4%
168%
Vitamin Comparison
Vitamin comparison score is based on the number of vitamins by which one or the other food is richer. The "coverage" charts below show how much of the daily needs can be covered by 300 grams of the food.
4
100 g
300 g
3 oz - 85g 1 piece, cooked, excluding refuse (yield from 1 lb raw meat with refuse) - 242g
Vitamin C
Vit. C
Vitamin D
Vit. D
Vitamin A
Vit. A
Vitamin E
Vit. E
Vitamin B1
Vit. B1
Vitamin B2
Vit. B2
Vitamin B3
Vit. B3
Vitamin B5
Vit. B5
Vitamin B6
Vit. B6
Vitamin B12
Vit. B12
Vitamin K
Vit. K
Folate
Folate
0%
1.5%
0%
2.8%
25%
58%
125%
40%
30%
319%
12%
14%
6
100 g
300 g
1 tbsp - 8.5g 1 large - 50g 1 cup, chopped - 136g
Vitamin C
Vit. C
Vitamin D
Vit. D
Vitamin A
Vit. A
Vitamin E
Vit. E
Vitamin B1
Vit. B1
Vitamin B2
Vit. B2
Vitamin B3
Vit. B3
Vitamin B5
Vit. B5
Vitamin B6
Vit. B6
Vitamin B12
Vit. B12
Vitamin K
Vit. K
Folate
Folate
0%
33%
50%
21%
17%
118%
1.2%
84%
28%
139%
0.75%
33%
All nutrients comparison - raw data values
Nutrient
DV% diff.
Copper
0.119mg
2mg
209%
Cholesterol
97mg
373mg
92%
Vitamin B12
2.55µg
1.11µg
60%
Vitamin B3
6.66mg
0.064mg
41%
Choline
93.7mg
293.8mg
36%
Zinc
4.46mg
1.05mg
31%
Saturated fat
8.83g
3.267g
25%
Protein
24.52g
12.58g
24%
Vitamin B2
0.25mg
0.513mg
20%
Vitamin A
0µg
149µg
17%
Fats
20.94g
10.61g
16%
Vitamin B5
0.66mg
1.398mg
15%
Monounsaturated fat
8.82g
4.077g
12%
Vitamin D*
2 IU
87 IU
11%
Vitamin D
0.1µg
2.2µg
11%
Iron
1.88mg
1.19mg
9%
Selenium
26.4µg
30.8µg
8%
Calories
294kcal
155kcal
7%
Folate
18µg
44µg
7%
Vitamin E
0.14mg
1.03mg
6%
Potassium
310mg
126mg
5%
Vitamin K
4.6µg
0.3µg
4%
Magnesium
23mg
10mg
3%
Calcium
17mg
50mg
3%
Vitamin B1
0.1mg
0.066mg
3%
Phosphorus
188mg
172mg
2%
Sodium
72mg
124mg
2%
Vitamin B6
0.13mg
0.121mg
1%
Polyunsaturated fat
1.51g
1.414g
1%
Protein per 100 calories
8.3g
8.1g
N/A
Calories per 10 g protein
120kcal
123kcal
N/A
Weight per 100 calories
34g
65g
N/A
Unsaturated / Saturated Fat ratio
1.2
1.7
N/A
Net carbs
0g
1.12g
N/A
Carbs
0g
1.12g
0%
Sugar
0g
1.12g
N/A
Manganese
0.022mg
0.026mg
0%
Tryptophan
0.287mg
0.153mg
0%
Threonine
1.05mg
0.604mg
0%
Isoleucine
1.183mg
0.686mg
0%
Leucine
1.908mg
1.075mg
0%
Lysine
2.166mg
0.904mg
0%
Methionine
0.629mg
0.392mg
0%
Phenylalanine
0.998mg
0.668mg
0%
Valine
1.323mg
0.767mg
0%
Histidine
0.777mg
0.298mg
0%
Omega-3 - EPA
0g
0.005g
N/A
Omega-3 - DHA
0g
0.038g
N/A
Macronutrient Comparison
Macronutrient breakdown side-by-side comparison
2
25%
21%
54%
Protein:
24.52 g
Fats:
20.94 g
Carbs:
0 g
Water:
53.72 g
Other:
0.82 g
3
13%
11%
75%
Protein:
12.58 g
Fats:
10.61 g
Carbs:
1.12 g
Water:
74.62 g
Other:
1.07 g
Contains
more
Protein Protein
+94.9%
Contains
more
Fats Fats
+97.4%
Contains
more
Carbs Carbs
+∞%
Contains
more
Water Water
+38.9%
Contains
more
Other Other
+30.5%
Fat Type Comparison
Fat type breakdown side-by-side comparison
2
46%
46%
8%
Saturated fat:
Sat. Fat
8.83 g
Monounsaturated fat:
Mono. Fat
8.82 g
Polyunsaturated fat:
Poly. Fat
1.51 g
1
37%
47%
16%
Saturated fat:
Sat. Fat
3.267 g
Monounsaturated fat:
Mono. Fat
4.077 g
Polyunsaturated fat:
Poly. Fat
1.414 g
Contains
more
Mono. Fat Monounsaturated fat
+116.3%
Contains
less
Sat. Fat Saturated fat
-63%
~equal in
Polyunsaturated fat
~1.414g