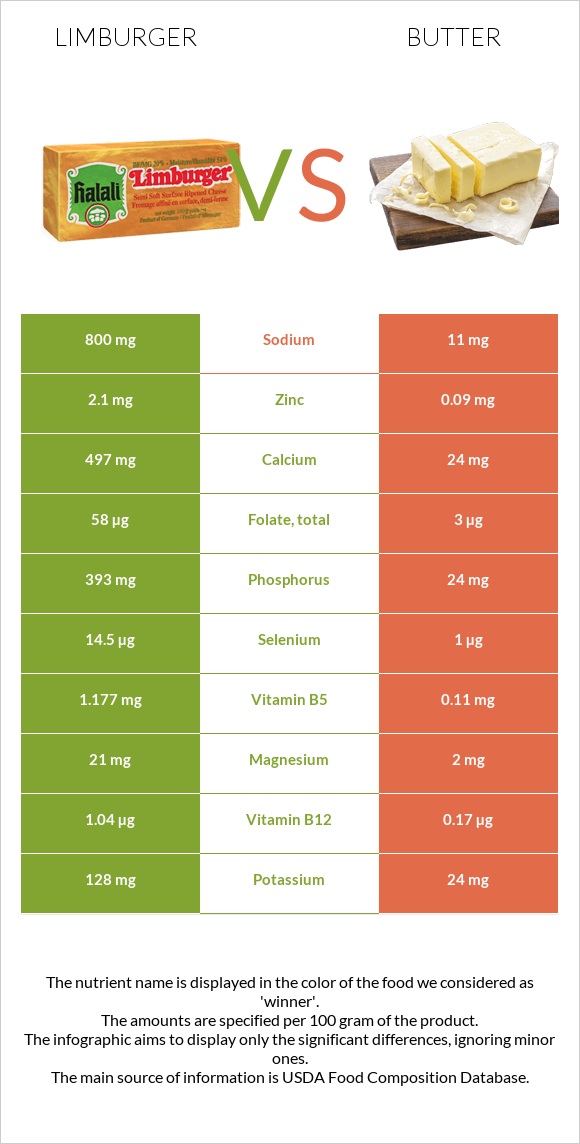
How are Limburger and butter different? Limburger is higher in phosphorus, calcium, vitamin B12, vitamin B2, selenium, and vitamin B5; however, butter is richer in vitamin A. Daily need coverage for saturated fat for butter is 169% higher. Limburger contains 73 times more sodium than butter. While Limburger contains 800mg of sodium, butter contains only 11mg. Butter has a lower glycemic index (0) than Limburger (27). Cheese, limburger and Butter, without salt are the varieties used in this article.
Infographic
Mineral Comparison
Mineral comparison score is based on the number of minerals by which one or the other food is richer. The "coverage" charts below show how much of the daily needs can be covered by 300 grams of the food.
9
100 g
300 g
1 cubic inch - 18g 1 oz - 28.35g 1 box - 113g 1 cup - 134g 1 package (8 oz) - 227g
Magnesium
Magnesium
Calcium
Calcium
Potassium
Potassium
Iron
Iron
Copper
Copper
Zinc
Zinc
Phosphorus
Phosphorus
Sodium
Sodium
Manganese
Manganese
Selenium
Selenium
15%
149%
11%
4.9%
7%
57%
168%
104%
5%
79%
1
100 g
300 g
1 pat (1" sq, 1/3" high) - 5g 1 tbsp - 14.2g 1 stick - 113g 1 cup - 227g
Magnesium
Magnesium
Calcium
Calcium
Potassium
Potassium
Iron
Iron
Copper
Copper
Zinc
Zinc
Phosphorus
Phosphorus
Sodium
Sodium
Manganese
Manganese
Selenium
Selenium
1.4%
7.2%
2.1%
0.75%
5.3%
2.5%
10%
1.4%
0.52%
5.5%
Vitamin Comparison
Vitamin comparison score is based on the number of vitamins by which one or the other food is richer. The "coverage" charts below show how much of the daily needs can be covered by 300 grams of the food.
8
100 g
300 g
1 cubic inch - 18g 1 oz - 28.35g 1 box - 113g 1 cup - 134g 1 package (8 oz) - 227g
Vitamin C
Vit. C
Vitamin D
Vit. D
Vitamin A
Vit. A
Vitamin E
Vit. E
Vitamin B1
Vit. B1
Vitamin B2
Vit. B2
Vitamin B3
Vit. B3
Vitamin B5
Vit. B5
Vitamin B6
Vit. B6
Vitamin B12
Vit. B12
Vitamin K
Vit. K
Folate
Folate
0%
7.5%
113%
4.6%
20%
116%
3%
71%
20%
130%
5.8%
44%
3
100 g
300 g
1 pat (1" sq, 1/3" high) - 5g 1 tbsp - 14.2g 1 stick - 113g 1 cup - 227g
Vitamin C
Vit. C
Vitamin D
Vit. D
Vitamin A
Vit. A
Vitamin E
Vit. E
Vitamin B1
Vit. B1
Vitamin B2
Vit. B2
Vitamin B3
Vit. B3
Vitamin B5
Vit. B5
Vitamin B6
Vit. B6
Vitamin B12
Vit. B12
Vitamin K
Vit. K
Folate
Folate
0%
0%
228%
46%
1.3%
7.8%
0.79%
6.6%
0.69%
21%
18%
2.3%
All nutrients comparison - raw data values
Nutrient
DV% diff.
Saturated fat
16.746g
50.489g
153%
Fats
27.25g
81.11g
83%
Phosphorus
393mg
24mg
53%
Calcium
497mg
24mg
47%
Cholesterol
90mg
215mg
42%
Protein
20.05g
0.85g
38%
Vitamin A
340µg
684µg
38%
Monounsaturated fat
8.606g
23.43g
37%
Vitamin B2
0.503mg
0.034mg
36%
Vitamin B12
1.04µg
0.17µg
36%
Sodium
800mg
11mg
34%
Selenium
14.5µg
1µg
25%
Vitamin B5
1.177mg
0.11mg
21%
Calories
327kcal
717kcal
20%
Zinc
2.1mg
0.09mg
18%
Polyunsaturated fat
0.495g
3.01g
17%
Vitamin E
0.23mg
2.32mg
14%
Folate
58µg
3µg
14%
Vitamin B1
0.08mg
0.005mg
6%
Vitamin B6
0.086mg
0.003mg
6%
Magnesium
21mg
2mg
5%
Vitamin K
2.3µg
7µg
4%
Vitamin D*
20 IU
0 IU
3%
Vitamin D
0.5µg
0µg
3%
Potassium
128mg
24mg
3%
Iron
0.13mg
0.02mg
1%
Copper
0.021mg
0.016mg
1%
Manganese
0.038mg
0.004mg
1%
Vitamin B3
0.158mg
0.042mg
1%
Choline
15.4mg
18.8mg
1%
Protein per 100 calories
6.1g
0.12g
N/A
Calories per 10 g protein
163kcal
8435kcal
N/A
Weight per 100 calories
31g
14g
N/A
Unsaturated / Saturated Fat ratio
0.54
0.52
N/A
Net carbs
0.49g
0.06g
N/A
Carbs
0.49g
0.06g
0%
Sugar
0.49g
0.06g
N/A
Tryptophan
0.289mg
0.012mg
0%
Threonine
0.739mg
0.038mg
0%
Isoleucine
1.219mg
0.051mg
0%
Leucine
2.093mg
0.083mg
0%
Lysine
1.675mg
0.067mg
0%
Methionine
0.619mg
0.021mg
0%
Phenylalanine
1.116mg
0.041mg
0%
Valine
1.439mg
0.057mg
0%
Histidine
0.578mg
0.023mg
0%
Omega-3 - ALA
0.315g
N/A
Omega-6 - Linoleic acid
2.166g
N/A
Macronutrient Comparison
Macronutrient breakdown side-by-side comparison
4
20%
27%
48%
4%
Protein:
20.05 g
Fats:
27.25 g
Carbs:
0.49 g
Water:
48.42 g
Other:
3.79 g
1
81%
18%
Protein:
0.85 g
Fats:
81.11 g
Carbs:
0.06 g
Water:
17.94 g
Other:
0.04 g
Contains
more
Protein Protein
+2258.8%
Contains
more
Carbs Carbs
+716.7%
Contains
more
Water Water
+169.9%
Contains
more
Other Other
+9375%
Contains
more
Fats Fats
+197.7%
Fat Type Comparison
Fat type breakdown side-by-side comparison
1
65%
33%
2%
Saturated fat:
Sat. Fat
16.746 g
Monounsaturated fat:
Mono. Fat
8.606 g
Polyunsaturated fat:
Poly. Fat
0.495 g
2
66%
30%
4%
Saturated fat:
Sat. Fat
50.489 g
Monounsaturated fat:
Mono. Fat
23.43 g
Polyunsaturated fat:
Poly. Fat
3.01 g
Contains
less
Sat. Fat Saturated fat
-66.8%
Contains
more
Mono. Fat Monounsaturated fat
+172.3%
Contains
more
Poly. Fat Polyunsaturated fat
+508.1%