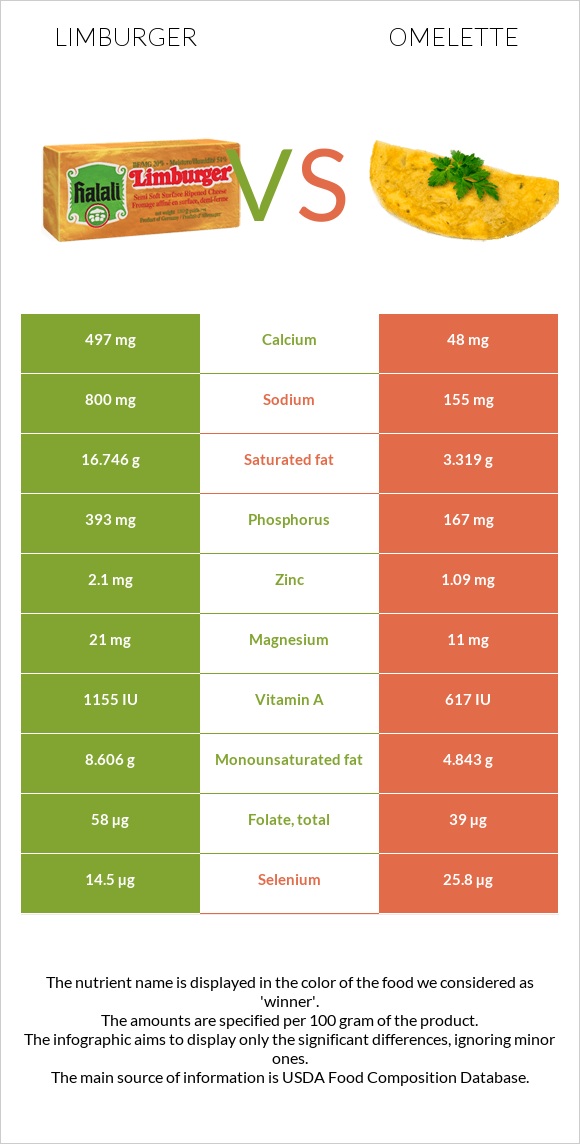
The main differences between Limburger and omelette Limburger has more calcium, phosphorus, vitamin B12, and vitamin A; however, omelette has more choline, selenium, and iron. Daily need coverage for cholesterol for omelette is 74% higher. Omelette has 10 times less calcium than Limburger. Limburger has 497mg of calcium, while omelette has 48mg. Omelette is lower in sodium. Limburger has a higher glycemic index than omelette. Food types used in this article are Cheese, limburger and Egg, whole, cooked, omelet .
Infographic
Mineral Comparison
Mineral comparison score is based on the number of minerals by which one or the other food is richer. The "coverage" charts below show how much of the daily needs can be covered by 300 grams of the food.
5
100 g
300 g
1 cubic inch - 18g 1 oz - 28.35g 1 box - 113g 1 cup - 134g 1 package (8 oz) - 227g
Magnesium
Magnesium
Calcium
Calcium
Potassium
Potassium
Iron
Iron
Copper
Copper
Zinc
Zinc
Phosphorus
Phosphorus
Sodium
Sodium
Manganese
Manganese
Selenium
Selenium
15%
149%
11%
4.9%
7%
57%
168%
104%
5%
79%
4
100 g
300 g
1 tbsp - 15g 1 large - 61g
Magnesium
Magnesium
Calcium
Calcium
Potassium
Potassium
Iron
Iron
Copper
Copper
Zinc
Zinc
Phosphorus
Phosphorus
Sodium
Sodium
Manganese
Manganese
Selenium
Selenium
7.9%
14%
10%
56%
21%
30%
72%
20%
3.1%
141%
Vitamin Comparison
Vitamin comparison score is based on the number of vitamins by which one or the other food is richer. The "coverage" charts below show how much of the daily needs can be covered by 300 grams of the food.
6
100 g
300 g
1 cubic inch - 18g 1 oz - 28.35g 1 box - 113g 1 cup - 134g 1 package (8 oz) - 227g
Vitamin C
Vit. C
Vitamin D
Vit. D
Vitamin A
Vit. A
Vitamin E
Vit. E
Vitamin B1
Vit. B1
Vitamin B2
Vit. B2
Vitamin B3
Vit. B3
Vitamin B5
Vit. B5
Vitamin B6
Vit. B6
Vitamin B12
Vit. B12
Vitamin K
Vit. K
Folate
Folate
0%
7.5%
113%
4.6%
20%
116%
3%
71%
20%
130%
5.8%
44%
4
100 g
300 g
1 tbsp - 15g 1 large - 61g
Vitamin C
Vit. C
Vitamin D
Vit. D
Vitamin A
Vit. A
Vitamin E
Vit. E
Vitamin B1
Vit. B1
Vitamin B2
Vit. B2
Vitamin B3
Vit. B3
Vitamin B5
Vit. B5
Vitamin B6
Vit. B6
Vitamin B12
Vit. B12
Vitamin K
Vit. K
Folate
Folate
0%
26%
57%
26%
8.5%
89%
1.2%
77%
33%
95%
11%
29%
All nutrients comparison - raw data values
Nutrient
DV% diff.
Cholesterol
90mg
313mg
74%
Saturated fat
16.746g
3.319g
61%
Calcium
497mg
48mg
45%
Choline
15.4mg
247.6mg
42%
Phosphorus
393mg
167mg
32%
Sodium
800mg
155mg
28%
Fats
27.25g
11.66g
24%
Selenium
14.5µg
25.8µg
21%
Protein
20.05g
10.57g
19%
Vitamin A
340µg
172µg
19%
Iron
0.13mg
1.48mg
17%
Polyunsaturated fat
0.495g
2.712g
15%
Vitamin B12
1.04µg
0.76µg
12%
Calories
327kcal
154kcal
9%
Zinc
2.1mg
1.09mg
9%
Vitamin B2
0.503mg
0.386mg
9%
Monounsaturated fat
8.606g
4.843g
9%
Vitamin E
0.23mg
1.29mg
7%
Vitamin D*
20 IU
69 IU
6%
Vitamin D
0.5µg
1.7µg
6%
Copper
0.021mg
0.063mg
5%
Folate
58µg
39µg
5%
Vitamin B1
0.08mg
0.034mg
4%
Vitamin B6
0.086mg
0.143mg
4%
Magnesium
21mg
11mg
2%
Vitamin B5
1.177mg
1.289mg
2%
Vitamin K
2.3µg
4.5µg
2%
Manganese
0.038mg
0.024mg
1%
Vitamin B3
0.158mg
0.064mg
1%
Protein per 100 calories
6.1g
6.9g
N/A
Calories per 10 g protein
163kcal
146kcal
N/A
Weight per 100 calories
31g
65g
N/A
Unsaturated / Saturated Fat ratio
0.54
2.3
N/A
Net carbs
0.49g
0.64g
N/A
Carbs
0.49g
0.64g
0%
Potassium
128mg
117mg
0%
Sugar
0.49g
0.31g
N/A
Trans fat
0.709g
N/A
Tryptophan
0.289mg
0.14mg
0%
Threonine
0.739mg
0.467mg
0%
Isoleucine
1.219mg
0.565mg
0%
Leucine
2.093mg
0.913mg
0%
Lysine
1.675mg
0.767mg
0%
Methionine
0.619mg
0.319mg
0%
Phenylalanine
1.116mg
0.572mg
0%
Valine
1.439mg
0.722mg
0%
Histidine
0.578mg
0.26mg
0%
Omega-3 - DHA
0g
0.049g
N/A
Omega-3 - DPA
0g
0.006g
N/A
Omega-6 - Eicosadienoic acid
0.015g
N/A
Macronutrient Comparison
Macronutrient breakdown side-by-side comparison
3
20%
27%
48%
4%
Protein:
20.05 g
Fats:
27.25 g
Carbs:
0.49 g
Water:
48.42 g
Other:
3.79 g
2
11%
12%
76%
Protein:
10.57 g
Fats:
11.66 g
Carbs:
0.64 g
Water:
76.13 g
Other:
1 g
Contains
more
Protein Protein
+89.7%
Contains
more
Fats Fats
+133.7%
Contains
more
Other Other
+279%
Contains
more
Carbs Carbs
+30.6%
Contains
more
Water Water
+57.2%
Fat Type Comparison
Fat type breakdown side-by-side comparison
1
65%
33%
2%
Saturated fat:
Sat. Fat
16.746 g
Monounsaturated fat:
Mono. Fat
8.606 g
Polyunsaturated fat:
Poly. Fat
0.495 g
2
31%
45%
25%
Saturated fat:
Sat. Fat
3.319 g
Monounsaturated fat:
Mono. Fat
4.843 g
Polyunsaturated fat:
Poly. Fat
2.712 g
Contains
more
Mono. Fat Monounsaturated fat
+77.7%
Contains
less
Sat. Fat Saturated fat
-80.2%
Contains
more
Poly. Fat Polyunsaturated fat
+447.9%