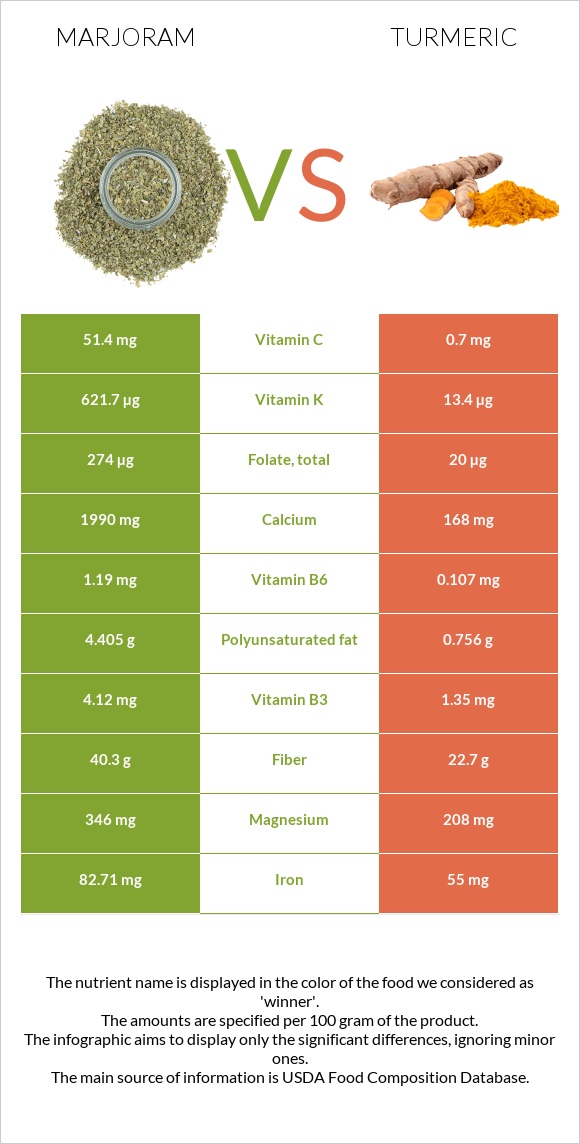
What are the main differences between marjoram and turmeric? Marjoram is richer in vitamin K, iron, calcium, vitamin A, vitamin B6, fiber, folate, vitamin C, and magnesium, yet turmeric is richer in manganese. Turmeric's daily need coverage for manganese is 625% higher. We used Spices, marjoram, dried and Spices, turmeric, ground types in this comparison.
Infographic
Mineral Comparison
Mineral comparison score is based on the number of minerals by which one or the other food is richer. The "coverage" charts below show how much of the daily needs can be covered by 300 grams of the food.
3
100 g
300 g
1 tsp - 0.6g 1 tbsp - 1.7g
Magnesium
Magnesium
Calcium
Calcium
Potassium
Potassium
Iron
Iron
Copper
Copper
Zinc
Zinc
Phosphorus
Phosphorus
Sodium
Sodium
Manganese
Manganese
Selenium
Selenium
247%
597%
134%
3102%
378%
98%
131%
10%
709%
25%
6
100 g
300 g
0.25 tsp - 0.5g 1 tbsp - 9.4g
Magnesium
Magnesium
Calcium
Calcium
Potassium
Potassium
Iron
Iron
Copper
Copper
Zinc
Zinc
Phosphorus
Phosphorus
Sodium
Sodium
Manganese
Manganese
Selenium
Selenium
149%
50%
184%
2063%
433%
123%
128%
3.5%
2583%
34%
Vitamin Comparison
Vitamin comparison score is based on the number of vitamins by which one or the other food is richer. The "coverage" charts below show how much of the daily needs can be covered by 300 grams of the food.
8
100 g
300 g
1 tsp - 0.6g 1 tbsp - 1.7g
Vitamin C
Vit. C
Vitamin D
Vit. D
Vitamin A
Vit. A
Vitamin E
Vit. E
Vitamin B1
Vit. B1
Vitamin B2
Vit. B2
Vitamin B3
Vit. B3
Vitamin B5
Vit. B5
Vitamin B6
Vit. B6
Vitamin B12
Vit. B12
Vitamin K
Vit. K
Folate
Folate
171%
0%
134%
34%
72%
73%
77%
0%
275%
0%
1554%
206%
2
100 g
300 g
0.25 tsp - 0.5g 1 tbsp - 9.4g
Vitamin C
Vit. C
Vitamin D
Vit. D
Vitamin A
Vit. A
Vitamin E
Vit. E
Vitamin B1
Vit. B1
Vitamin B2
Vit. B2
Vitamin B3
Vit. B3
Vitamin B5
Vit. B5
Vitamin B6
Vit. B6
Vitamin B12
Vit. B12
Vitamin K
Vit. K
Folate
Folate
2.3%
0%
0%
89%
15%
35%
25%
33%
25%
0%
34%
15%
All nutrients comparison - raw data values
Nutrient
DV% diff.
Manganese
5.433mg
19.8mg
625%
Vitamin K
621.7µg
13.4µg
507%
Iron
82.71mg
55mg
346%
Calcium
1990mg
168mg
182%
Vitamin B6
1.19mg
0.107mg
83%
Fiber
40.3g
22.7g
70%
Folate
274µg
20µg
64%
Vitamin C
51.4mg
0.7mg
56%
Vitamin A
403µg
0µg
45%
Magnesium
346mg
208mg
33%
Polyunsaturated fat
4.405g
0.756g
24%
Copper
1.133mg
1.3mg
19%
Vitamin B1
0.289mg
0.058mg
19%
Vitamin E
1.69mg
4.43mg
18%
Vitamin B3
4.12mg
1.35mg
17%
Potassium
1522mg
2080mg
16%
Vitamin B2
0.316mg
0.15mg
13%
Vitamin B5
0.542mg
11%
Zinc
3.6mg
4.5mg
8%
Protein
12.66g
9.68g
6%
Fats
7.04g
3.25g
6%
Saturated fat
0.529g
1.838g
6%
Selenium
4.5µg
6.2µg
3%
Calories
271kcal
312kcal
2%
Carbs
60.56g
67.14g
2%
Sodium
77mg
27mg
2%
Phosphorus
306mg
299mg
1%
Choline
43.6mg
49.2mg
1%
Monounsaturated fat
0.94g
0.449g
1%
Fructose
0.45g
1%
Protein per 100 calories
4.7g
3.1g
N/A
Calories per 10 g protein
214kcal
322kcal
N/A
Weight per 100 calories
37g
32g
N/A
Unsaturated / Saturated Fat ratio
10
0.66
N/A
Net carbs
20.26g
44.44g
N/A
Sugar
4.09g
3.21g
N/A
Trans fat
0g
0.056g
N/A
Tryptophan
0.17mg
0%
Threonine
0.33mg
0%
Isoleucine
0.47mg
0%
Leucine
0.81mg
0%
Lysine
0.38mg
0%
Methionine
0.14mg
0%
Phenylalanine
0.53mg
0%
Valine
0.66mg
0%
Histidine
0.15mg
0%
Omega-3 - ALA
0.003g
N/A
Omega-6 - Gamma-linoleic acid
0.081g
N/A
Macronutrient Comparison
Macronutrient breakdown side-by-side comparison
3
13%
7%
61%
8%
12%
Protein:
12.66 g
Fats:
7.04 g
Carbs:
60.56 g
Water:
7.64 g
Other:
12.1 g
2
10%
3%
67%
13%
7%
Protein:
9.68 g
Fats:
3.25 g
Carbs:
67.14 g
Water:
12.85 g
Other:
7.08 g
Contains
more
Protein Protein
+30.8%
Contains
more
Fats Fats
+116.6%
Contains
more
Other Other
+70.9%
Contains
more
Carbs Carbs
+10.9%
Contains
more
Water Water
+68.2%
Fat Type Comparison
Fat type breakdown side-by-side comparison
3
9%
16%
75%
Saturated fat:
Sat. Fat
0.529 g
Monounsaturated fat:
Mono. Fat
0.94 g
Polyunsaturated fat:
Poly. Fat
4.405 g
0
60%
15%
25%
Saturated fat:
Sat. Fat
1.838 g
Monounsaturated fat:
Mono. Fat
0.449 g
Polyunsaturated fat:
Poly. Fat
0.756 g
Contains
less
Sat. Fat Saturated fat
-71.2%
Contains
more
Mono. Fat Monounsaturated fat
+109.4%
Contains
more
Poly. Fat Polyunsaturated fat
+482.7%