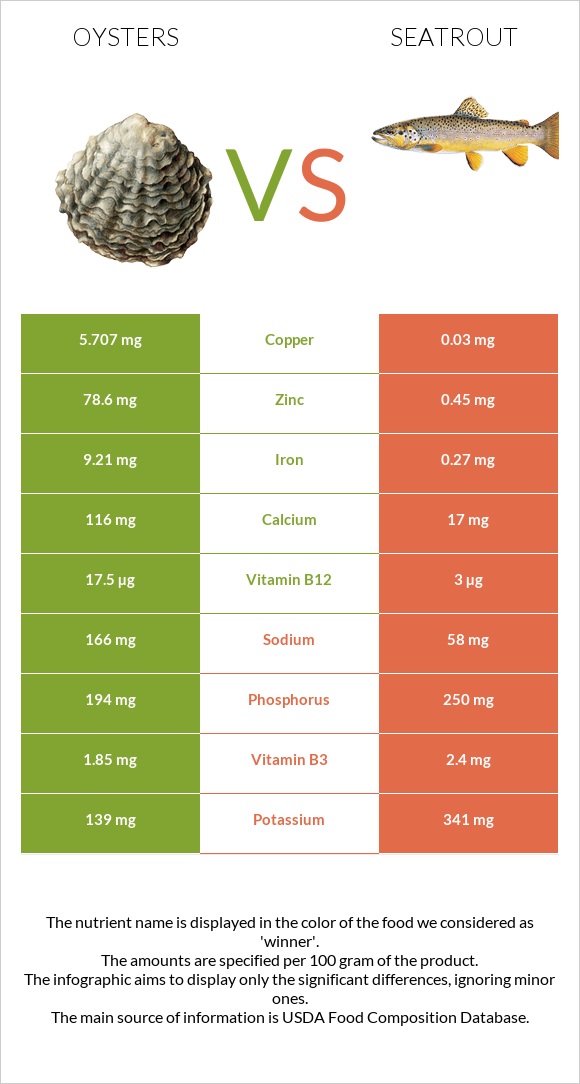
Summary of differences between oysters and seatrout Oysters has more zinc, copper, vitamin B12, iron, manganese, and calcium; however, seatrout is higher in vitamin B6, phosphorus, and selenium. Oysters covers your daily need for zinc, 709% more than seatrout. Oysters has 150 times more copper than seatrout. While oysters has 5.707mg of copper, seatrout has only 0.038mg. Oysters has less cholesterol. These are the specific foods used in this comparison Mollusks, oyster, eastern, wild, cooked, moist heat and Fish, seatrout, mixed species, cooked, dry heat .
Infographic
Mineral Comparison
Mineral comparison score is based on the number of minerals by which one or the other food is richer. The "coverage" charts below show how much of the daily needs can be covered by 300 grams of the food.
5
100 g
300 g
6 medium - 42g 3 oz - 85g
Magnesium
Magnesium
Calcium
Calcium
Potassium
Potassium
Iron
Iron
Copper
Copper
Zinc
Zinc
Phosphorus
Phosphorus
Sodium
Sodium
Manganese
Manganese
Selenium
Selenium
25%
35%
12%
345%
1902%
2144%
83%
22%
77%
215%
5
100 g
300 g
3 oz - 85g 1 fillet - 186g
Magnesium
Magnesium
Calcium
Calcium
Potassium
Potassium
Iron
Iron
Copper
Copper
Zinc
Zinc
Phosphorus
Phosphorus
Sodium
Sodium
Manganese
Manganese
Selenium
Selenium
29%
6.6%
39%
13%
13%
16%
138%
9.7%
2.5%
255%
Vitamin Comparison
Vitamin comparison score is based on the number of vitamins by which one or the other food is richer. The "coverage" charts below show how much of the daily needs can be covered by 300 grams of the food.
4
100 g
300 g
6 medium - 42g 3 oz - 85g
Vitamin C
Vit. C
Vitamin D
Vit. D
Vitamin A
Vit. A
Vitamin E
Vit. E
Vitamin B1
Vit. B1
Vitamin B2
Vit. B2
Vitamin B3
Vit. B3
Vitamin B5
Vit. B5
Vitamin B6
Vit. B6
Vitamin B12
Vit. B12
Vitamin K
Vit. K
Folate
Folate
0%
0%
8.7%
34%
9%
42%
35%
27%
14%
2188%
5%
11%
6
100 g
300 g
3 oz - 85g 1 fillet - 186g
Vitamin C
Vit. C
Vitamin D
Vit. D
Vitamin A
Vit. A
Vitamin E
Vit. E
Vitamin B1
Vit. B1
Vitamin B2
Vit. B2
Vitamin B3
Vit. B3
Vitamin B5
Vit. B5
Vitamin B6
Vit. B6
Vitamin B12
Vit. B12
Vitamin K
Vit. K
Folate
Folate
0%
0%
12%
0%
17%
48%
55%
52%
107%
433%
0%
4.5%
All nutrients comparison - raw data values
Nutrient
DV% diff.
Zinc
78.6mg
0.58mg
709%
Copper
5.707mg
0.038mg
630%
Vitamin B12
17.5µg
3.46µg
585%
Iron
9.21mg
0.35mg
111%
Vitamin B6
0.061mg
0.462mg
31%
Manganese
0.591mg
0.019mg
25%
Choline
130mg
24%
Protein
11.42g
21.46g
20%
Phosphorus
194mg
321mg
18%
Selenium
39.5µg
46.8µg
13%
Vitamin E
1.7mg
11%
Cholesterol
79mg
106mg
9%
Calcium
116mg
22mg
9%
Potassium
139mg
437mg
9%
Vitamin B5
0.447mg
0.865mg
8%
Vitamin B3
1.85mg
2.923mg
7%
Sodium
166mg
74mg
4%
Vitamin B1
0.036mg
0.069mg
3%
Calories
102kcal
133kcal
2%
Fats
3.42g
4.63g
2%
Carbs
5.45g
0g
2%
Vitamin B2
0.18mg
0.207mg
2%
Vitamin K
2µg
2%
Folate
14µg
6µg
2%
Saturated fat
0.948g
1.293g
2%
Monounsaturated fat
0.506g
1.133g
2%
Magnesium
35mg
40mg
1%
Vitamin A
26µg
35µg
1%
Polyunsaturated fat
1.056g
0.929g
1%
Protein per 100 calories
11g
16g
N/A
Calories per 10 g protein
89kcal
62kcal
N/A
Weight per 100 calories
98g
75g
N/A
Unsaturated / Saturated Fat ratio
1.6
1.6
N/A
Net carbs
5.45g
0g
N/A
Vitamin D*
2 IU
0%
Sugar
1.23g
N/A
Starch
0.9g
0%
Trans fat
0.068g
N/A
Tryptophan
0.138mg
0.24mg
0%
Threonine
0.046mg
0.941mg
0%
Isoleucine
0.459mg
0.989mg
0%
Leucine
0.716mg
1.744mg
0%
Lysine
0.762mg
1.971mg
0%
Methionine
0.257mg
0.635mg
0%
Phenylalanine
0.413mg
0.838mg
0%
Valine
0.523mg
1.106mg
0%
Histidine
0.22mg
0.632mg
0%
Omega-3 - EPA
0.353g
0.211g
N/A
Omega-3 - DHA
0.271g
0.265g
N/A
Omega-3 - ALA
0.163g
N/A
Omega-3 - DPA
0.02g
0.097g
N/A
Omega-3 - Eicosatrienoic acid
0.004g
N/A
Omega-6 - Gamma-linoleic acid
0.004g
N/A
Omega-6 - Dihomo-gamma-linoleic acid
0.007g
N/A
Omega-6 - Eicosadienoic acid
0.007g
N/A
Omega-6 - Linoleic acid
0.061g
N/A
Macronutrient Comparison
Macronutrient breakdown side-by-side comparison
2
11%
3%
5%
78%
Protein:
11.42 g
Fats:
3.42 g
Carbs:
5.45 g
Water:
78.19 g
Other:
1.52 g
3
21%
5%
72%
2%
Protein:
21.46 g
Fats:
4.63 g
Carbs:
0 g
Water:
71.91 g
Other:
2 g
Contains
more
Carbs Carbs
+∞%
Contains
more
Protein Protein
+87.9%
Contains
more
Fats Fats
+35.4%
Contains
more
Other Other
+31.6%
Fat Type Comparison
Fat type breakdown side-by-side comparison
2
38%
20%
42%
Saturated fat:
Sat. Fat
0.948 g
Monounsaturated fat:
Mono. Fat
0.506 g
Polyunsaturated fat:
Poly. Fat
1.056 g
1
39%
34%
28%
Saturated fat:
Sat. Fat
1.293 g
Monounsaturated fat:
Mono. Fat
1.133 g
Polyunsaturated fat:
Poly. Fat
0.929 g
Contains
less
Sat. Fat Saturated fat
-26.7%
Contains
more
Poly. Fat Polyunsaturated fat
+13.7%
Contains
more
Mono. Fat Monounsaturated fat
+123.9%