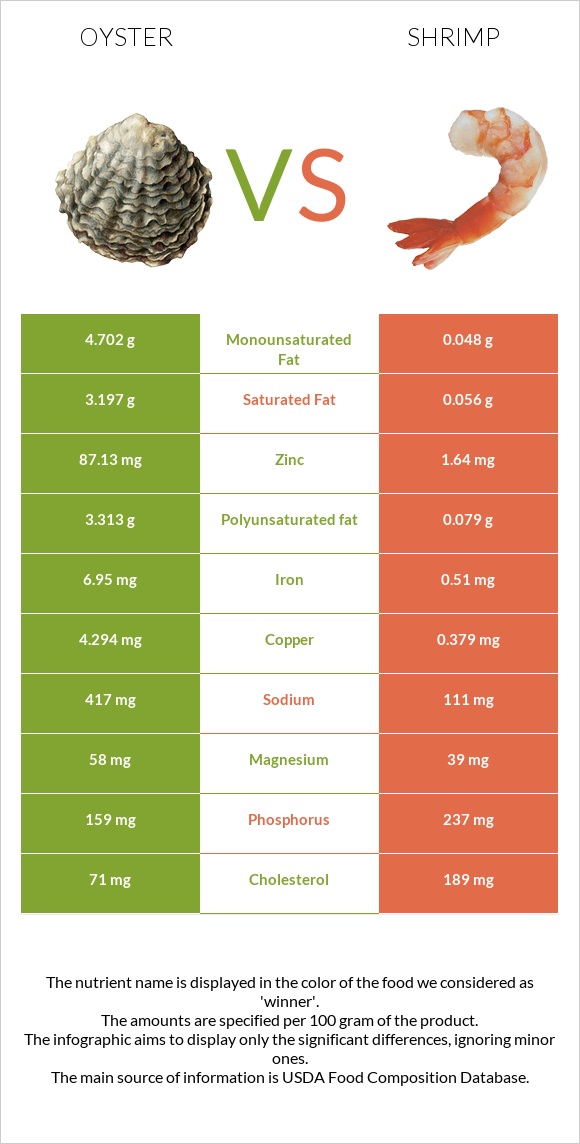
Significant differences between oysters and shrimp Oysters has more zinc, vitamin B12, copper, iron, and manganese; however, shrimp is richer in selenium, phosphorus, and vitamin B6. Oysters covers your daily zinc needs 700% more than shrimp. Shrimp has 29 times less iron than oysters. Oysters has 9.21mg of iron, while shrimp has 0.32mg. Oysters contains less cholesterol. Shrimp has a higher glycemic index. The glycemic index of shrimp is 50, while the glycemic index of oysters is 0. Specific food types used in this comparison are Mollusks, oyster, eastern, wild, cooked, moist heat and Crustaceans, shrimp, mixed species, cooked, moist heat (may have been previously frozen) .
Infographic
Mineral Comparison
Mineral comparison score is based on the number of minerals by which one or the other food is richer. The "coverage" charts below show how much of the daily needs can be covered by 300 grams of the food.
6
100 g
300 g
6 medium - 42g 3 oz - 85g
Magnesium
Magnesium
Calcium
Calcium
Potassium
Potassium
Iron
Iron
Copper
Copper
Zinc
Zinc
Phosphorus
Phosphorus
Sodium
Sodium
Manganese
Manganese
Selenium
Selenium
25%
35%
12%
345%
1902%
2144%
83%
22%
77%
215%
3
100 g
300 g
4 large - 22g 3 oz - 85g
Magnesium
Magnesium
Calcium
Calcium
Potassium
Potassium
Iron
Iron
Copper
Copper
Zinc
Zinc
Phosphorus
Phosphorus
Sodium
Sodium
Manganese
Manganese
Selenium
Selenium
26%
27%
15%
12%
86%
44%
131%
124%
6.4%
270%
Vitamin Comparison
Vitamin comparison score is based on the number of vitamins by which one or the other food is richer. The "coverage" charts below show how much of the daily needs can be covered by 300 grams of the food.
4
100 g
300 g
6 medium - 42g 3 oz - 85g
Vitamin C
Vit. C
Vitamin D
Vit. D
Vitamin A
Vit. A
Vitamin E
Vit. E
Vitamin B1
Vit. B1
Vitamin B2
Vit. B2
Vitamin B3
Vit. B3
Vitamin B5
Vit. B5
Vitamin B6
Vit. B6
Vitamin B12
Vit. B12
Vitamin K
Vit. K
Folate
Folate
0%
0%
8.7%
34%
9%
42%
35%
27%
14%
2188%
5%
11%
7
100 g
300 g
4 large - 22g 3 oz - 85g
Vitamin C
Vit. C
Vitamin D
Vit. D
Vitamin A
Vit. A
Vitamin E
Vit. E
Vitamin B1
Vit. B1
Vitamin B2
Vit. B2
Vitamin B3
Vit. B3
Vitamin B5
Vit. B5
Vitamin B6
Vit. B6
Vitamin B12
Vit. B12
Vitamin K
Vit. K
Folate
Folate
0%
1.5%
30%
44%
8%
5.5%
50%
31%
56%
208%
1%
18%
All nutrients comparison - raw data values
Nutrient
DV% diff.
Zinc
78.6mg
1.63mg
700%
Vitamin B12
17.5µg
1.66µg
660%
Copper
5.707mg
0.258mg
605%
Iron
9.21mg
0.32mg
111%
Cholesterol
79mg
211mg
44%
Sodium
166mg
947mg
34%
Manganese
0.591mg
0.049mg
24%
Protein
11.42g
22.78g
23%
Selenium
39.5µg
49.5µg
18%
Phosphorus
194mg
306mg
16%
Vitamin B6
0.061mg
0.242mg
14%
Vitamin B2
0.18mg
0.024mg
12%
Vitamin A
26µg
90µg
7%
Vitamin B3
1.85mg
2.678mg
5%
Fats
3.42g
1.7g
3%
Calcium
116mg
91mg
3%
Vitamin E
1.7mg
2.2mg
3%
Folate
14µg
24µg
3%
Polyunsaturated fat
1.056g
0.59g
3%
Saturated fat
0.948g
0.521g
2%
Calories
102kcal
119kcal
1%
Carbs
5.45g
1.52g
1%
Vitamin D
0µg
0.1µg
1%
Potassium
139mg
170mg
1%
Vitamin B5
0.447mg
0.519mg
1%
Vitamin K
2µg
0.4µg
1%
Choline
130mg
135.4mg
1%
Protein per 100 calories
11g
19g
N/A
Calories per 10 g protein
89kcal
52kcal
N/A
Weight per 100 calories
98g
84g
N/A
Unsaturated / Saturated Fat ratio
1.6
1.8
N/A
Net carbs
5.45g
1.52g
N/A
Vitamin D*
2 IU
4 IU
0%
Magnesium
35mg
37mg
0%
Sugar
1.23g
0g
N/A
Starch
0.9g
0g
0%
Vitamin B1
0.036mg
0.032mg
0%
Trans fat
0.068g
0.035g
N/A
Monounsaturated fat
0.506g
0.361g
0%
Tryptophan
0.138mg
0.26mg
0%
Threonine
0.046mg
0.904mg
0%
Isoleucine
0.459mg
1.05mg
0%
Leucine
0.716mg
1.95mg
0%
Lysine
0.762mg
2.172mg
0%
Methionine
0.257mg
0.665mg
0%
Phenylalanine
0.413mg
0.992mg
0%
Valine
0.523mg
1.067mg
0%
Histidine
0.22mg
0.501mg
0%
Omega-3 - EPA
0.353g
0.135g
N/A
Omega-3 - DHA
0.271g
0.141g
N/A
Omega-3 - ALA
0.163g
N/A
Omega-3 - DPA
0.02g
0.012g
N/A
Omega-3 - Eicosatrienoic acid
0.004g
N/A
Omega-6 - Gamma-linoleic acid
0.004g
N/A
Omega-6 - Dihomo-gamma-linoleic acid
0.007g
N/A
Omega-6 - Eicosadienoic acid
0.007g
0.012g
N/A
Omega-6 - Linoleic acid
0.061g
N/A
Macronutrient Comparison
Macronutrient breakdown side-by-side comparison
3
11%
3%
5%
78%
Protein:
11.42 g
Fats:
3.42 g
Carbs:
5.45 g
Water:
78.19 g
Other:
1.52 g
2
23%
2%
72%
2%
Protein:
22.78 g
Fats:
1.7 g
Carbs:
1.52 g
Water:
71.56 g
Other:
2.44 g
Contains
more
Fats Fats
+101.2%
Contains
more
Carbs Carbs
+258.6%
Contains
more
Protein Protein
+99.5%
Contains
more
Other Other
+60.5%
Fat Type Comparison
Fat type breakdown side-by-side comparison
2
38%
20%
42%
Saturated fat:
Sat. Fat
0.948 g
Monounsaturated fat:
Mono. Fat
0.506 g
Polyunsaturated fat:
Poly. Fat
1.056 g
1
35%
25%
40%
Saturated fat:
Sat. Fat
0.521 g
Monounsaturated fat:
Mono. Fat
0.361 g
Polyunsaturated fat:
Poly. Fat
0.59 g
Contains
more
Mono. Fat Monounsaturated fat
+40.2%
Contains
more
Poly. Fat Polyunsaturated fat
+79%
Contains
less
Sat. Fat Saturated fat
-45%