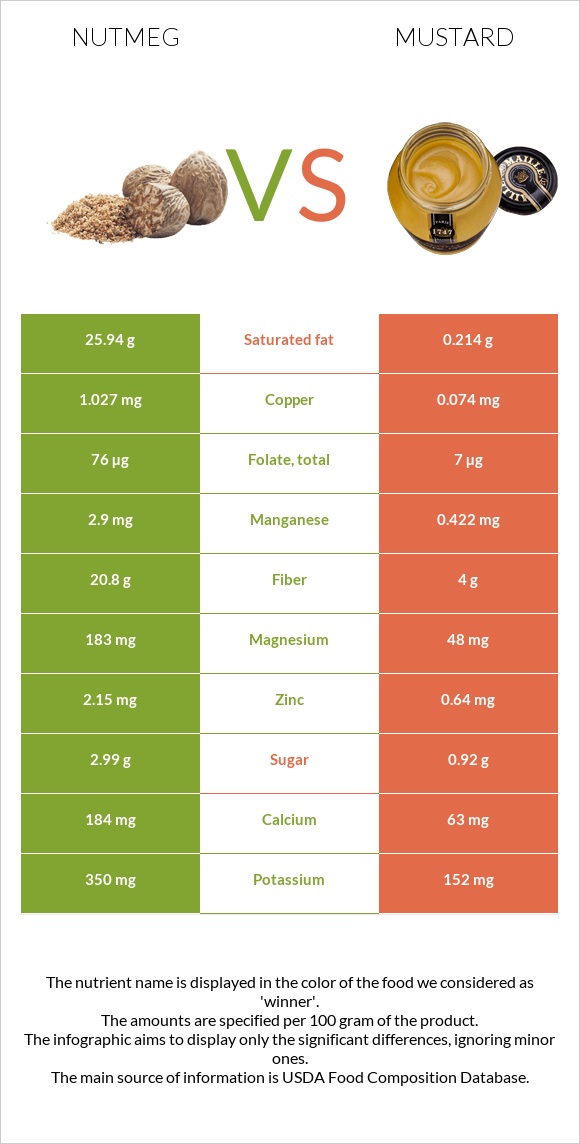
Differences between nutmeg and mustard Nutmeg has more manganese, copper, fiber, magnesium, iron, folate, and phosphorus, while mustard has more selenium. Nutmeg's daily need coverage for saturated fat is 129% higher. Mustard contains 14 times less copper than nutmeg. Nutmeg contains 1.027mg of copper, while mustard contains 0.074mg. The amount of saturated fat in mustard is lower. Nutmeg has a lower glycemic index. The glycemic index of nutmeg is 0, while the glycemic index of mustard is 32. The food types used in this comparison are Spices, nutmeg, ground and Mustard, prepared, yellow .
Infographic
Mineral Comparison
Mineral comparison score is based on the number of minerals by which one or the other food is richer. The "coverage" charts below show how much of the daily needs can be covered by 300 grams of the food.
9
100 g
300 g
0.25 tsp - 0.5g 1 tbsp - 7g
Magnesium
Magnesium
Calcium
Calcium
Potassium
Potassium
Iron
Iron
Copper
Copper
Zinc
Zinc
Phosphorus
Phosphorus
Sodium
Sodium
Manganese
Manganese
Selenium
Selenium
131%
55%
31%
114%
342%
59%
91%
2.1%
378%
8.7%
1
100 g
300 g
1 tsp or 1 packet - 5g 1 cup - 249g
Magnesium
Magnesium
Calcium
Calcium
Potassium
Potassium
Iron
Iron
Copper
Copper
Zinc
Zinc
Phosphorus
Phosphorus
Sodium
Sodium
Manganese
Manganese
Selenium
Selenium
34%
19%
13%
60%
25%
17%
46%
144%
55%
183%
Vitamin Comparison
Vitamin comparison score is based on the number of vitamins by which one or the other food is richer. The "coverage" charts below show how much of the daily needs can be covered by 300 grams of the food.
5
100 g
300 g
0.25 tsp - 0.5g 1 tbsp - 7g
Vitamin C
Vit. C
Vitamin D
Vit. D
Vitamin A
Vit. A
Vitamin E
Vit. E
Vitamin B1
Vit. B1
Vitamin B2
Vit. B2
Vitamin B3
Vit. B3
Vitamin B5
Vit. B5
Vitamin B6
Vit. B6
Vitamin B12
Vit. B12
Vitamin K
Vit. K
Folate
Folate
10%
0%
1.7%
0%
87%
13%
24%
0%
37%
0%
0%
57%
4
100 g
300 g
1 tsp or 1 packet - 5g 1 cup - 249g
Vitamin C
Vit. C
Vitamin D
Vit. D
Vitamin A
Vit. A
Vitamin E
Vit. E
Vitamin B1
Vit. B1
Vitamin B2
Vit. B2
Vitamin B3
Vit. B3
Vitamin B5
Vit. B5
Vitamin B6
Vit. B6
Vitamin B12
Vit. B12
Vitamin K
Vit. K
Folate
Folate
1%
0%
1.7%
7.2%
44%
16%
11%
15%
16%
0%
3.5%
5.3%
All nutrients comparison - raw data values
Nutrient
DV% diff.
Saturated fat
25.94g
0.214g
117%
Manganese
2.9mg
0.422mg
108%
Copper
1.027mg
0.074mg
106%
Fiber
20.8g
4g
67%
Selenium
1.6µg
33.5µg
58%
Fats
36.31g
3.34g
51%
Sodium
16mg
1104mg
47%
Magnesium
183mg
48mg
32%
Calories
525kcal
60kcal
23%
Iron
3.04mg
1.61mg
18%
Folate
76µg
7µg
17%
Phosphorus
213mg
108mg
15%
Carbs
49.29g
5.83g
14%
Zinc
2.15mg
0.64mg
14%
Vitamin B1
0.346mg
0.177mg
14%
Calcium
184mg
63mg
12%
Vitamin B6
0.16mg
0.07mg
7%
Potassium
350mg
152mg
6%
Vitamin B3
1.299mg
0.565mg
5%
Vitamin B5
0.254mg
5%
Protein
5.84g
3.74g
4%
Vitamin C
3mg
0.3mg
3%
Monounsaturated fat
3.22g
2.182g
3%
Polyunsaturated fat
0.35g
0.774g
3%
Vitamin E
0mg
0.36mg
2%
Choline
8.8mg
22.4mg
2%
Vitamin B2
0.057mg
0.07mg
1%
Vitamin K
0µg
1.4µg
1%
Protein per 100 calories
1.1g
6.2g
N/A
Calories per 10 g protein
899kcal
160kcal
N/A
Weight per 100 calories
19g
167g
N/A
Unsaturated / Saturated Fat ratio
0.14
14
N/A
Net carbs
28.49g
1.83g
N/A
Sugar
2.99g
0.92g
N/A
Starch
0.64g
0%
Vitamin A
5µg
5µg
0%
Trans fat
0.009g
N/A
Tryptophan
0.009mg
0%
Threonine
0.167mg
0%
Isoleucine
0.146mg
0%
Leucine
0.292mg
0%
Lysine
0.264mg
0%
Methionine
0.076mg
0%
Phenylalanine
0.161mg
0%
Valine
0.189mg
0%
Histidine
0.119mg
0%
Fructose
0.23g
0%
Omega-3 - ALA
0.373g
N/A
Omega-3 - Eicosatrienoic acid
0.018g
N/A
Omega-6 - Eicosadienoic acid
0.01g
N/A
Omega-6 - Linoleic acid
0.358g
N/A
Macronutrient Comparison
Macronutrient breakdown side-by-side comparison
3
6%
36%
49%
6%
2%
Protein:
5.84 g
Fats:
36.31 g
Carbs:
49.29 g
Water:
6.23 g
Other:
2.33 g
2
4%
3%
6%
84%
3%
Protein:
3.74 g
Fats:
3.34 g
Carbs:
5.83 g
Water:
83.72 g
Other:
3.37 g
Contains
more
Protein Protein
+56.1%
Contains
more
Fats Fats
+987.1%
Contains
more
Carbs Carbs
+745.5%
Contains
more
Water Water
+1243.8%
Contains
more
Other Other
+44.6%
Fat Type Comparison
Fat type breakdown side-by-side comparison
1
88%
11%
Saturated fat:
Sat. Fat
25.94 g
Monounsaturated fat:
Mono. Fat
3.22 g
Polyunsaturated fat:
Poly. Fat
0.35 g
2
7%
69%
24%
Saturated fat:
Sat. Fat
0.214 g
Monounsaturated fat:
Mono. Fat
2.182 g
Polyunsaturated fat:
Poly. Fat
0.774 g
Contains
more
Mono. Fat Monounsaturated fat
+47.6%
Contains
less
Sat. Fat Saturated fat
-99.2%
Contains
more
Poly. Fat Polyunsaturated fat
+121.1%