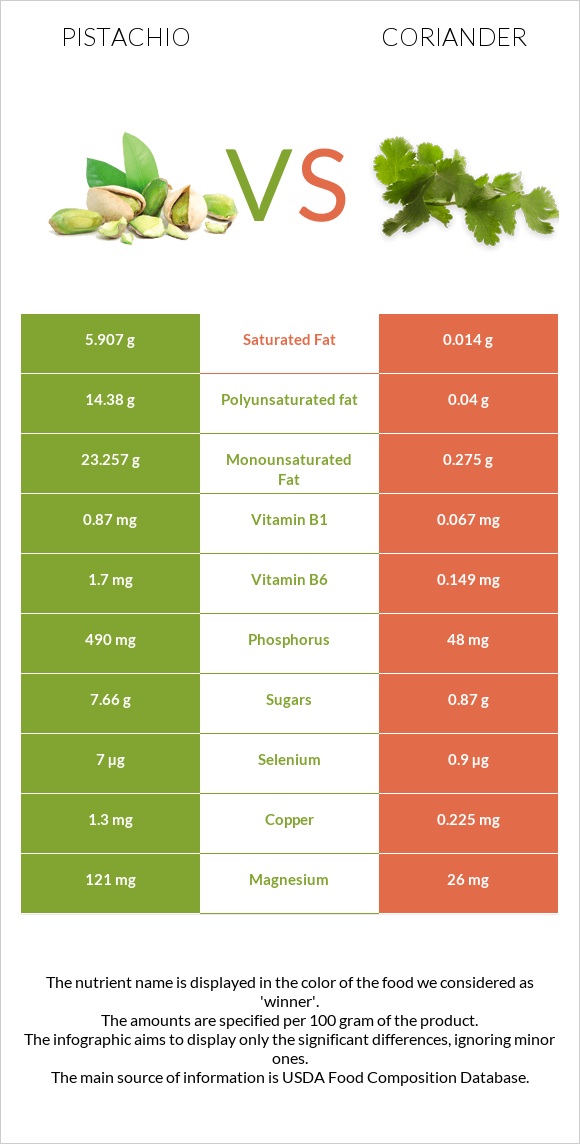
What are the main differences between pistachios and coriander? Pistachios are richer in copper, vitamin B6, vitamin B1, phosphorus, manganese, fiber, and iron, yet coriander is richer in vitamin A and vitamin C. Coriander's daily need coverage for vitamin A is 125% higher. Pistachios have 422 times more saturated fat than coriander. Pistachios have 5.907g of saturated fat, while coriander has 0.014g. We used Nuts, pistachio nuts, raw and Coriander (cilantro) leaves, raw types in this comparison.
Infographic
Mineral Comparison
Mineral comparison score is based on the number of minerals by which one or the other food is richer. The "coverage" charts below show how much of the daily needs can be covered by 300 grams of the food.
10
100 g
300 g
1 kernel - 0.7g 1 oz (49 kernels) - 28.35g 1 cup - 123g
Magnesium
Magnesium
Calcium
Calcium
Potassium
Potassium
Iron
Iron
Copper
Copper
Zinc
Zinc
Phosphorus
Phosphorus
Sodium
Sodium
Manganese
Manganese
Selenium
Selenium
86%
32%
90%
147%
433%
60%
210%
0.13%
157%
38%
0
100 g
300 g
0.25 cup - 4g 9 sprigs - 20g
Magnesium
Magnesium
Calcium
Calcium
Potassium
Potassium
Iron
Iron
Copper
Copper
Zinc
Zinc
Phosphorus
Phosphorus
Sodium
Sodium
Manganese
Manganese
Selenium
Selenium
19%
20%
46%
66%
75%
14%
21%
6%
56%
4.9%
Vitamin Comparison
Vitamin comparison score is based on the number of vitamins by which one or the other food is richer. The "coverage" charts below show how much of the daily needs can be covered by 300 grams of the food.
4
100 g
300 g
1 kernel - 0.7g 1 oz (49 kernels) - 28.35g 1 cup - 123g
Vitamin C
Vit. C
Vitamin D
Vit. D
Vitamin A
Vit. A
Vitamin E
Vit. E
Vitamin B1
Vit. B1
Vitamin B2
Vit. B2
Vitamin B3
Vit. B3
Vitamin B5
Vit. B5
Vitamin B6
Vit. B6
Vitamin B12
Vit. B12
Vitamin K
Vit. K
Folate
Folate
19%
0%
8.7%
57%
218%
37%
24%
31%
392%
0%
0%
38%
4
100 g
300 g
0.25 cup - 4g 9 sprigs - 20g
Vitamin C
Vit. C
Vitamin D
Vit. D
Vitamin A
Vit. A
Vitamin E
Vit. E
Vitamin B1
Vit. B1
Vitamin B2
Vit. B2
Vitamin B3
Vit. B3
Vitamin B5
Vit. B5
Vitamin B6
Vit. B6
Vitamin B12
Vit. B12
Vitamin K
Vit. K
Folate
Folate
90%
0%
112%
50%
17%
37%
21%
34%
34%
0%
775%
47%
All nutrients comparison - raw data values
Nutrient
DV% diff.
Vitamin K
310µg
258%
Copper
1.3mg
0.225mg
119%
Vitamin B6
1.7mg
0.149mg
119%
Polyunsaturated fat
14.38g
0.04g
96%
Fats
45.32g
0.52g
69%
Vitamin B1
0.87mg
0.067mg
67%
Phosphorus
490mg
48mg
63%
Monounsaturated fat
23.257g
0.275g
57%
Protein
20.16g
2.13g
36%
Vitamin A
26µg
337µg
35%
Manganese
1.2mg
0.426mg
34%
Fiber
10.6g
2.8g
31%
Calories
560kcal
23kcal
27%
Iron
3.92mg
1.77mg
27%
Saturated fat
5.907g
0.014g
27%
Vitamin C
5.6mg
27mg
24%
Magnesium
121mg
26mg
23%
Potassium
1025mg
521mg
15%
Zinc
2.2mg
0.5mg
15%
Selenium
7µg
0.9µg
11%
Carbs
27.17g
3.67g
8%
Calcium
105mg
67mg
4%
Folate
51µg
62µg
3%
Sodium
1mg
46mg
2%
Vitamin E
2.86mg
2.5mg
2%
Choline
12.8mg
2%
Starch
1.67g
1%
Vitamin B3
1.3mg
1.114mg
1%
Vitamin B5
0.52mg
0.57mg
1%
Protein per 100 calories
3.6g
9.3g
N/A
Calories per 10 g protein
278kcal
108kcal
N/A
Weight per 100 calories
18g
435g
N/A
Unsaturated / Saturated Fat ratio
6.4
23
N/A
Net carbs
16.57g
0.87g
N/A
Sugar
7.66g
0.87g
N/A
Vitamin B2
0.16mg
0.162mg
0%
Tryptophan
0.251mg
0%
Threonine
0.684mg
0%
Isoleucine
0.917mg
0%
Leucine
1.604mg
0%
Lysine
1.138mg
0%
Methionine
0.36mg
0%
Phenylalanine
1.092mg
0%
Valine
1.249mg
0%
Histidine
0.512mg
0%
Fructose
0.24g
0%
Omega-6 - Linoleic acid
14.091g
N/A
Macronutrient Comparison
Macronutrient breakdown side-by-side comparison
4
20%
45%
27%
4%
3%
Protein:
20.16 g
Fats:
45.32 g
Carbs:
27.17 g
Water:
4.37 g
Other:
2.98 g
1
2%
4%
92%
Protein:
2.13 g
Fats:
0.52 g
Carbs:
3.67 g
Water:
92.21 g
Other:
1.47 g
Contains
more
Protein Protein
+846.5%
Contains
more
Fats Fats
+8615.4%
Contains
more
Carbs Carbs
+640.3%
Contains
more
Other Other
+102.7%
Contains
more
Water Water
+2010.1%
Fat Type Comparison
Fat type breakdown side-by-side comparison
2
14%
53%
33%
Saturated fat:
Sat. Fat
5.907 g
Monounsaturated fat:
Mono. Fat
23.257 g
Polyunsaturated fat:
Poly. Fat
14.38 g
1
4%
84%
12%
Saturated fat:
Sat. Fat
0.014 g
Monounsaturated fat:
Mono. Fat
0.275 g
Polyunsaturated fat:
Poly. Fat
0.04 g
Contains
more
Mono. Fat Monounsaturated fat
+8357.1%
Contains
more
Poly. Fat Polyunsaturated fat
+35850%
Contains
less
Sat. Fat Saturated fat
-99.8%