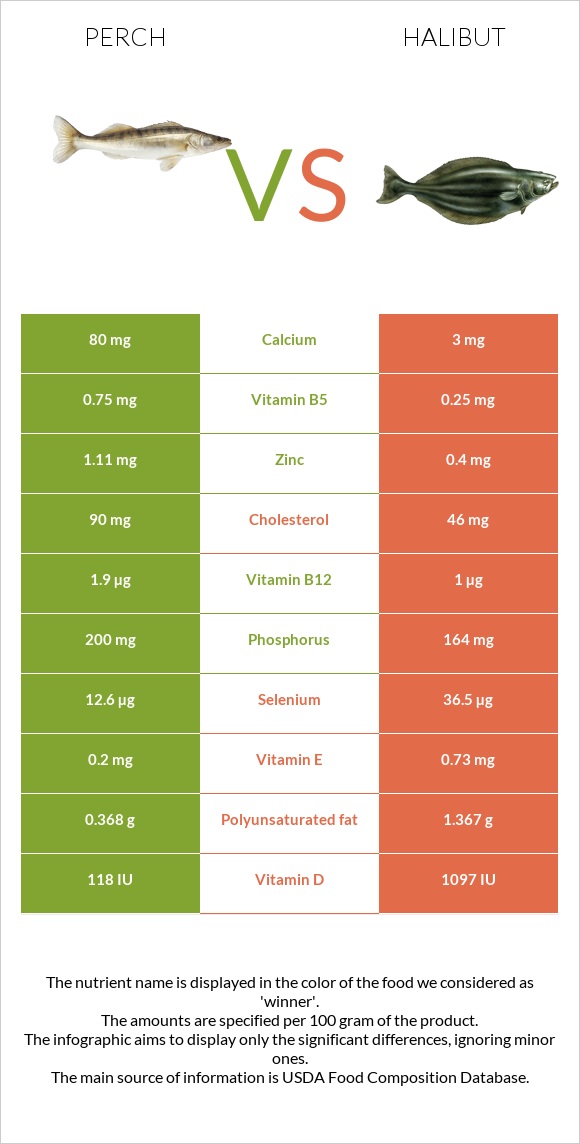
What are the differences between perch and halibut? Perch is higher in vitamin B12, manganese, copper, vitamin B5, calcium, and zinc, yet halibut is higher in selenium and vitamin B6. Halibut's daily need coverage for selenium is 56% more. Perch has 60 times more manganese than halibut. While perch has 0.9mg of manganese, halibut has only 0.015mg. The amount of cholesterol in halibut is lower. We used Fish, perch, mixed species, cooked, dry heat and Fish, halibut, greenland, cooked, dry heat types in this article.
Infographic
Mineral Comparison
Mineral comparison score is based on the number of minerals by which one or the other food is richer. The "coverage" charts below show how much of the daily needs can be covered by 300 grams of the food.
8
100 g
300 g
1 fillet - 46g 3 oz - 85g
Magnesium
Magnesium
Calcium
Calcium
Potassium
Potassium
Iron
Iron
Copper
Copper
Zinc
Zinc
Phosphorus
Phosphorus
Sodium
Sodium
Manganese
Manganese
Selenium
Selenium
27%
31%
30%
44%
64%
39%
110%
10%
117%
88%
1
100 g
300 g
3 oz - 85g 0.5 fillet - 159g
Magnesium
Magnesium
Calcium
Calcium
Potassium
Potassium
Iron
Iron
Copper
Copper
Zinc
Zinc
Phosphorus
Phosphorus
Sodium
Sodium
Manganese
Manganese
Selenium
Selenium
24%
1.2%
30%
32%
13%
14%
90%
13%
2%
255%
Vitamin Comparison
Vitamin comparison score is based on the number of vitamins by which one or the other food is richer. The "coverage" charts below show how much of the daily needs can be covered by 300 grams of the food.
5
100 g
300 g
1 fillet - 46g 3 oz - 85g
Vitamin C
Vit. C
Vitamin D
Vit. D
Vitamin A
Vit. A
Vitamin E
Vit. E
Vitamin B1
Vit. B1
Vitamin B2
Vit. B2
Vitamin B3
Vit. B3
Vitamin B5
Vit. B5
Vitamin B6
Vit. B6
Vitamin B12
Vit. B12
Vitamin K
Vit. K
Folate
Folate
5.7%
0%
3.3%
0%
20%
28%
36%
52%
32%
275%
0%
4.5%
2
100 g
300 g
3 oz - 85g 0.5 fillet - 159g
Vitamin C
Vit. C
Vitamin D
Vit. D
Vitamin A
Vit. A
Vitamin E
Vit. E
Vitamin B1
Vit. B1
Vitamin B2
Vit. B2
Vitamin B3
Vit. B3
Vitamin B5
Vit. B5
Vitamin B6
Vit. B6
Vitamin B12
Vit. B12
Vitamin K
Vit. K
Folate
Folate
0%
0%
6%
0%
18%
24%
36%
17%
112%
120%
0%
0.75%
All nutrients comparison - raw data values
Nutrient
DV% diff.
Selenium
16.1µg
46.8µg
56%
Vitamin B12
2.2µg
0.96µg
52%
Manganese
0.9mg
0.015mg
38%
Vitamin B6
0.14mg
0.485mg
27%
Monounsaturated fat
0.195g
10.742g
26%
Fats
1.18g
17.74g
25%
Cholesterol
115mg
59mg
19%
Copper
0.192mg
0.038mg
17%
Protein
24.86g
18.42g
13%
Saturated fat
0.237g
3.102g
13%
Vitamin B5
0.87mg
0.288mg
12%
Calcium
102mg
4mg
10%
Polyunsaturated fat
0.472g
1.753g
9%
Zinc
1.43mg
0.51mg
8%
Phosphorus
257mg
210mg
7%
Calories
117kcal
239kcal
6%
Iron
1.16mg
0.85mg
4%
Vitamin C
1.7mg
0mg
2%
Magnesium
38mg
33mg
1%
Sodium
79mg
103mg
1%
Vitamin A
10µg
18µg
1%
Vitamin B1
0.08mg
0.073mg
1%
Vitamin B2
0.12mg
0.103mg
1%
Folate
6µg
1µg
1%
Protein per 100 calories
21g
7.7g
N/A
Calories per 10 g protein
47kcal
130kcal
N/A
Weight per 100 calories
85g
42g
N/A
Unsaturated / Saturated Fat ratio
2.8
4
N/A
Potassium
344mg
344mg
0%
Vitamin B3
1.9mg
1.923mg
0%
Tryptophan
0.278mg
0.206mg
0%
Threonine
1.09mg
0.808mg
0%
Isoleucine
1.145mg
0.849mg
0%
Leucine
2.02mg
1.497mg
0%
Lysine
2.283mg
1.692mg
0%
Methionine
0.736mg
0.545mg
0%
Phenylalanine
0.97mg
0.719mg
0%
Valine
1.281mg
0.949mg
0%
Histidine
0.732mg
0.542mg
0%
Omega-3 - EPA
0.101g
0.674g
N/A
Omega-3 - DHA
0.223g
0.504g
N/A
Omega-3 - DPA
0.036g
0.114g
N/A
Macronutrient Comparison
Macronutrient breakdown side-by-side comparison
2
25%
73%
Protein:
24.86 g
Fats:
1.18 g
Carbs:
0 g
Water:
73.25 g
Other:
0.71 g
2
18%
18%
62%
2%
Protein:
18.42 g
Fats:
17.74 g
Carbs:
0 g
Water:
61.88 g
Other:
1.96 g
Contains
more
Protein Protein
+35%
Contains
more
Water Water
+18.4%
Contains
more
Fats Fats
+1403.4%
Contains
more
Other Other
+176.1%
Fat Type Comparison
Fat type breakdown side-by-side comparison
1
26%
22%
52%
Saturated fat:
Sat. Fat
0.237 g
Monounsaturated fat:
Mono. Fat
0.195 g
Polyunsaturated fat:
Poly. Fat
0.472 g
2
20%
69%
11%
Saturated fat:
Sat. Fat
3.102 g
Monounsaturated fat:
Mono. Fat
10.742 g
Polyunsaturated fat:
Poly. Fat
1.753 g
Contains
less
Sat. Fat Saturated fat
-92.4%
Contains
more
Mono. Fat Monounsaturated fat
+5408.7%
Contains
more
Poly. Fat Polyunsaturated fat
+271.4%