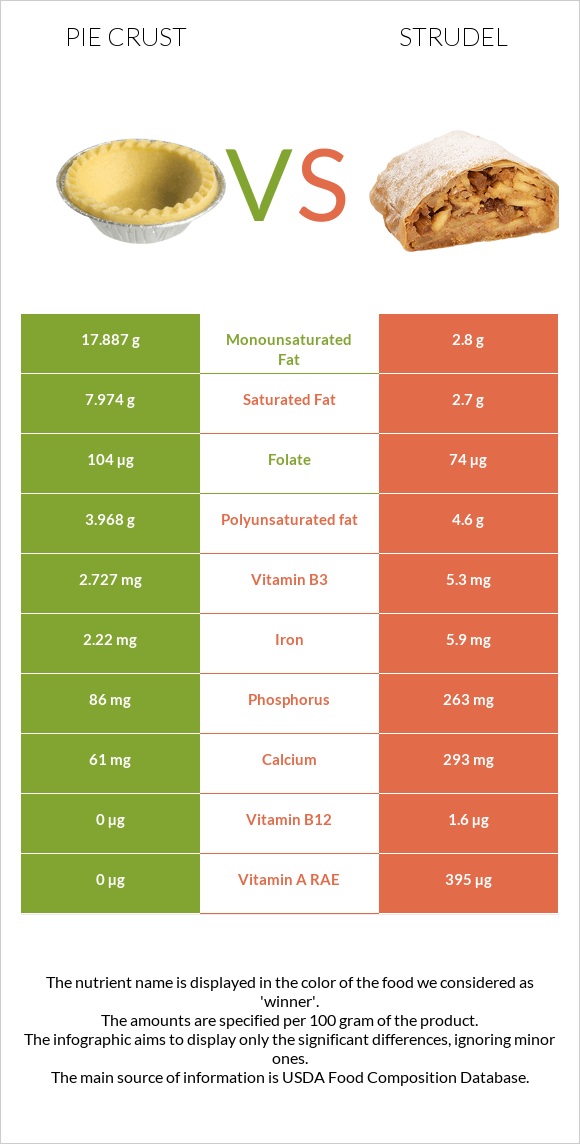
Significant differences between pie crust and strudel Pie crust has more folate; however, strudel is richer in vitamin B12, iron, vitamin B6, vitamin A, phosphorus, calcium, vitamin B2, and vitamin B3. Strudel covers your daily vitamin B12 needs 67% more than pie crust. Strudel has 3 times less saturated fat than pie crust. Pie crust has 7.974g of saturated fat, while strudel has 2.7g. Specific food types used in this comparison are Pie crust, standard-type, dry mix and KELLOGG'S, EGGO, Wafflers, Strawberry Strudel .
Infographic
Mineral Comparison
Mineral comparison score is based on the number of minerals by which one or the other food is richer. The "coverage" charts below show how much of the daily needs can be covered by 300 grams of the food.
4
100 g
300 g
1 oz - 28.35g 1 package (10 oz) - 284g
Magnesium
Magnesium
Calcium
Calcium
Potassium
Potassium
Iron
Iron
Copper
Copper
Zinc
Zinc
Phosphorus
Phosphorus
Sodium
Sodium
Manganese
Manganese
Selenium
Selenium
11%
18%
5.6%
83%
25%
11%
37%
98%
41%
125%
4
100 g
300 g
2 waffles - 76g
Magnesium
Magnesium
Calcium
Calcium
Potassium
Potassium
Iron
Iron
Copper
Copper
Zinc
Zinc
Phosphorus
Phosphorus
Sodium
Sodium
Manganese
Manganese
Selenium
Selenium
9.3%
88%
6.3%
221%
0%
11%
113%
90%
0%
0%
Vitamin Comparison
Vitamin comparison score is based on the number of vitamins by which one or the other food is richer. The "coverage" charts below show how much of the daily needs can be covered by 300 grams of the food.
2
100 g
300 g
1 oz - 28.35g 1 package (10 oz) - 284g
Vitamin C
Vit. C
Vitamin D
Vit. D
Vitamin A
Vit. A
Vitamin E
Vit. E
Vitamin B1
Vit. B1
Vitamin B2
Vit. B2
Vitamin B3
Vit. B3
Vitamin B5
Vit. B5
Vitamin B6
Vit. B6
Vitamin B12
Vit. B12
Vitamin K
Vit. K
Folate
Folate
0%
0%
0%
0%
98%
49%
51%
16%
15%
0%
0%
78%
5
100 g
300 g
2 waffles - 76g
Vitamin C
Vit. C
Vitamin D
Vit. D
Vitamin A
Vit. A
Vitamin E
Vit. E
Vitamin B1
Vit. B1
Vitamin B2
Vit. B2
Vitamin B3
Vit. B3
Vitamin B5
Vit. B5
Vitamin B6
Vit. B6
Vitamin B12
Vit. B12
Vitamin K
Vit. K
Folate
Folate
0%
0%
132%
0%
98%
104%
99%
0%
122%
200%
0%
56%
All nutrients comparison - raw data values
Nutrient
DV% diff.
Vitamin B12
0µg
1.6µg
67%
Iron
2.22mg
5.9mg
46%
Vitamin A
0µg
395µg
44%
Selenium
22.9µg
42%
Monounsaturated fat
17.887g
2.8g
38%
Vitamin B6
0.064mg
0.53mg
36%
Fats
31.4g
11g
31%
Phosphorus
86mg
263mg
25%
Saturated fat
7.974g
2.7g
24%
Calcium
61mg
293mg
23%
Vitamin B2
0.213mg
0.45mg
18%
Vitamin B3
2.727mg
5.3mg
16%
Manganese
0.315mg
14%
Calories
518kcal
318kcal
10%
Copper
0.075mg
8%
Folate
104µg
74µg
8%
Fiber
1.2g
5%
Vitamin B5
0.268mg
5%
Protein
6.9g
5g
4%
Cholesterol
0mg
12mg
4%
Polyunsaturated fat
3.968g
4.6g
4%
Sodium
753mg
691mg
3%
Carbs
52.1g
50g
1%
Protein per 100 calories
1.3g
1.6g
N/A
Calories per 10 g protein
751kcal
636kcal
N/A
Weight per 100 calories
19g
31g
N/A
Unsaturated / Saturated Fat ratio
2.7
2.7
N/A
Net carbs
52.1g
48.8g
N/A
Vitamin D*
1 IU
0%
Magnesium
15mg
13mg
0%
Potassium
64mg
71mg
0%
Sugar
16.8g
N/A
Zinc
0.4mg
0.4mg
0%
Vitamin B1
0.392mg
0.39mg
0%
Trans fat
0.2g
N/A
Tryptophan
0.08mg
0%
Threonine
0.184mg
0%
Isoleucine
0.255mg
0%
Leucine
0.476mg
0%
Lysine
0.133mg
0%
Methionine
0.121mg
0%
Phenylalanine
0.339mg
0%
Valine
0.289mg
0%
Histidine
0.146mg
0%
Macronutrient Comparison
Macronutrient breakdown side-by-side comparison
3
7%
31%
52%
8%
2%
Protein:
6.9 g
Fats:
31.4 g
Carbs:
52.1 g
Water:
7.6 g
Other:
2 g
2
5%
11%
50%
29%
5%
Protein:
5 g
Fats:
11 g
Carbs:
50 g
Water:
29.2 g
Other:
4.8 g
Contains
more
Protein Protein
+38%
Contains
more
Fats Fats
+185.5%
Contains
more
Water Water
+284.2%
Contains
more
Other Other
+140%
Fat Type Comparison
Fat type breakdown side-by-side comparison
1
27%
60%
13%
Saturated fat:
Sat. Fat
7.974 g
Monounsaturated fat:
Mono. Fat
17.887 g
Polyunsaturated fat:
Poly. Fat
3.968 g
2
27%
28%
46%
Saturated fat:
Sat. Fat
2.7 g
Monounsaturated fat:
Mono. Fat
2.8 g
Polyunsaturated fat:
Poly. Fat
4.6 g
Contains
more
Mono. Fat Monounsaturated fat
+538.8%
Contains
less
Sat. Fat Saturated fat
-66.1%
Contains
more
Poly. Fat Polyunsaturated fat
+15.9%