How are prunes and pretzel different? Prunes are richer in vitamin K, vitamin A, potassium, and fiber, while pretzel is higher in iron, folate, manganese, vitamin B1, and vitamin B3. Pretzel covers your daily need for sodium, 54% more than prunes. Prunes are lower in sodium. Pretzel has a higher glycemic index (83) than prunes (29). Plums, dried (prunes), uncooked and Snacks, pretzels, hard, plain, salted types were used in this article.
Infographic
Mineral Comparison
Mineral comparison score is based on the number of minerals by which one or the other food is richer. The "coverage" charts below show how much of the daily needs can be covered by 300 grams of the food.
5
100 g
300 g
1 prune, pitted - 9.5g 1 cup, pitted - 174g
Magnesium
Magnesium
Calcium
Calcium
Potassium
Potassium
Iron
Iron
Copper
Copper
Zinc
Zinc
Phosphorus
Phosphorus
Sodium
Sodium
Manganese
Manganese
Selenium
Selenium
29%
13%
65%
35%
94%
12%
30%
0.26%
39%
1.6%
5
100 g
300 g
1 oz - 28.35g 10 twists - 60g
Magnesium
Magnesium
Calcium
Calcium
Potassium
Potassium
Iron
Iron
Copper
Copper
Zinc
Zinc
Phosphorus
Phosphorus
Sodium
Sodium
Manganese
Manganese
Selenium
Selenium
21%
8.1%
20%
172%
52%
28%
55%
162%
132%
24%
Vitamin Comparison
Vitamin comparison score is based on the number of vitamins by which one or the other food is richer. The "coverage" charts below show how much of the daily needs can be covered by 300 grams of the food.
4
100 g
300 g
1 prune, pitted - 9.5g 1 cup, pitted - 174g
Vitamin C
Vit. C
Vitamin D
Vit. D
Vitamin A
Vit. A
Vitamin E
Vit. E
Vitamin B1
Vit. B1
Vitamin B2
Vit. B2
Vitamin B3
Vit. B3
Vitamin B5
Vit. B5
Vitamin B6
Vit. B6
Vitamin B12
Vit. B12
Vitamin K
Vit. K
Folate
Folate
2%
0%
13%
8.6%
13%
43%
35%
25%
47%
0%
149%
3%
5
100 g
300 g
1 oz - 28.35g 10 twists - 60g
Vitamin C
Vit. C
Vitamin D
Vit. D
Vitamin A
Vit. A
Vitamin E
Vit. E
Vitamin B1
Vit. B1
Vitamin B2
Vit. B2
Vitamin B3
Vit. B3
Vitamin B5
Vit. B5
Vitamin B6
Vit. B6
Vitamin B12
Vit. B12
Vitamin K
Vit. K
Folate
Folate
7%
0%
0%
9.4%
106%
77%
99%
19%
17%
0%
7%
125%
All nutrients comparison - raw data values
Nutrient
DV% diff.
Sodium
2mg
1240mg
54%
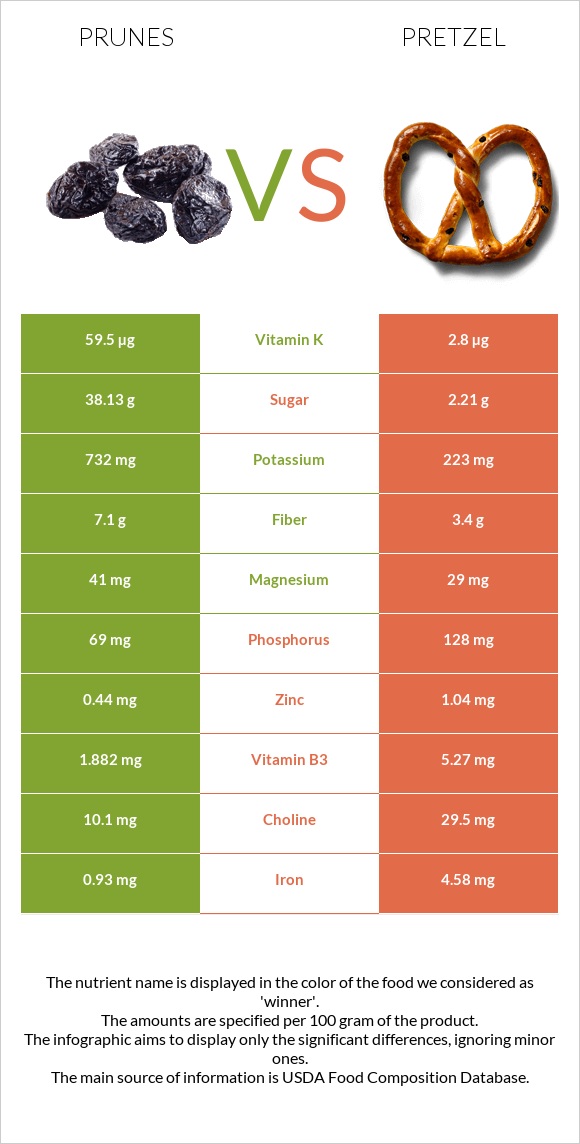
Vitamin K
59.5µg
2.8µg
47%
Iron
0.93mg
4.58mg
46%
Folate
4µg
166µg
41%
Manganese
0.299mg
1.015mg
31%
Vitamin B1
0.051mg
0.424mg
31%
Starch
5.11g
72.58g
28%
Vitamin B3
1.882mg
5.27mg
21%
Protein
2.18g
10.04g
16%
Potassium
732mg
223mg
15%
Fiber
7.1g
3.4g
15%
Fructose
12.45g
0.31g
15%
Copper
0.281mg
0.156mg
14%
Vitamin B2
0.186mg
0.332mg
11%
Vitamin B6
0.205mg
0.074mg
10%
Phosphorus
69mg
128mg
8%
Polyunsaturated fat
0.062g
1.291g
8%
Calories
240kcal
384kcal
7%
Selenium
0.3µg
4.4µg
7%
Carbs
63.88g
80.39g
6%
Zinc
0.44mg
1.04mg
5%
Fats
0.38g
2.93g
4%
Vitamin A
39µg
0µg
4%
Choline
10.1mg
29.5mg
4%
Magnesium
41mg
29mg
3%
Vitamin C
0.6mg
2.1mg
2%
Calcium
43mg
27mg
2%
Vitamin B5
0.422mg
0.322mg
2%
Monounsaturated fat
0.053g
0.727g
2%
Saturated fat
0.088g
0.391g
1%
Protein per 100 calories
0.91g
2.6g
N/A
Calories per 10 g protein
1101kcal
382kcal
N/A
Weight per 100 calories
42g
26g
N/A
Unsaturated / Saturated Fat ratio
1.3
5.2
N/A
Net carbs
56.78g
76.99g
N/A
Sugar
38.13g
2.21g
N/A
Vitamin E
0.43mg
0.47mg
0%
Trans fat
0.004g
N/A
Tryptophan
0.025mg
0.097mg
0%
Threonine
0.049mg
0.25mg
0%
Isoleucine
0.041mg
0.407mg
0%
Leucine
0.066mg
0.757mg
0%
Lysine
0.05mg
0.257mg
0%
Methionine
0.016mg
0.177mg
0%
Phenylalanine
0.052mg
0.52mg
0%
Valine
0.056mg
0.48mg
0%
Histidine
0.027mg
0.22mg
0%
Omega-3 - ALA
0.063g
N/A
Omega-6 - Gamma-linoleic acid
0g
0.001g
N/A
Omega-6 - Linoleic acid
1.223g
N/A
Macronutrient Comparison
Macronutrient breakdown side-by-side comparison
1
2%
64%
31%
3%
Protein:
2.18 g
Fats:
0.38 g
Carbs:
63.88 g
Water:
30.92 g
Other:
2.64 g
4
10%
3%
80%
3%
4%
Protein:
10.04 g
Fats:
2.93 g
Carbs:
80.39 g
Water:
3.13 g
Other:
3.51 g
Contains
more
Water Water
+887.9%
Contains
more
Protein Protein
+360.6%
Contains
more
Fats Fats
+671.1%
Contains
more
Carbs Carbs
+25.8%
Contains
more
Other Other
+33%
Fat Type Comparison
Fat type breakdown side-by-side comparison
1
43%
26%
31%
Saturated fat:
Sat. Fat
0.088 g
Monounsaturated fat:
Mono. Fat
0.053 g
Polyunsaturated fat:
Poly. Fat
0.062 g
2
16%
30%
54%
Saturated fat:
Sat. Fat
0.391 g
Monounsaturated fat:
Mono. Fat
0.727 g
Polyunsaturated fat:
Poly. Fat
1.291 g
Contains
less
Sat. Fat Saturated fat
-77.5%
Contains
more
Mono. Fat Monounsaturated fat
+1271.7%
Contains
more
Poly. Fat Polyunsaturated fat
+1982.3%
Carbohydrate type comparison
Carbohydrate type breakdown side-by-side comparison
3
12%
59%
29%
Starch:
5.11 g
Sucrose:
0.15 g
Glucose:
25.46 g
Fructose:
12.45 g
Lactose:
0 g
Maltose:
0.06 g
Galactose:
0 g
2
97%
Starch:
72.58 g
Sucrose:
0 g
Glucose:
0.69 g
Fructose:
0.31 g
Lactose:
0 g
Maltose:
1.11 g
Galactose:
0 g
Contains
more
Sucrose Sucrose
+∞%
Contains
more
Glucose Glucose
+3589.9%
Contains
more
Fructose Fructose
+3916.1%
Contains
more
Starch Starch
+1320.4%
Contains
more
Maltose Maltose
+1750%
~equal in
Lactose
~0g
~equal in
Galactose
~0g