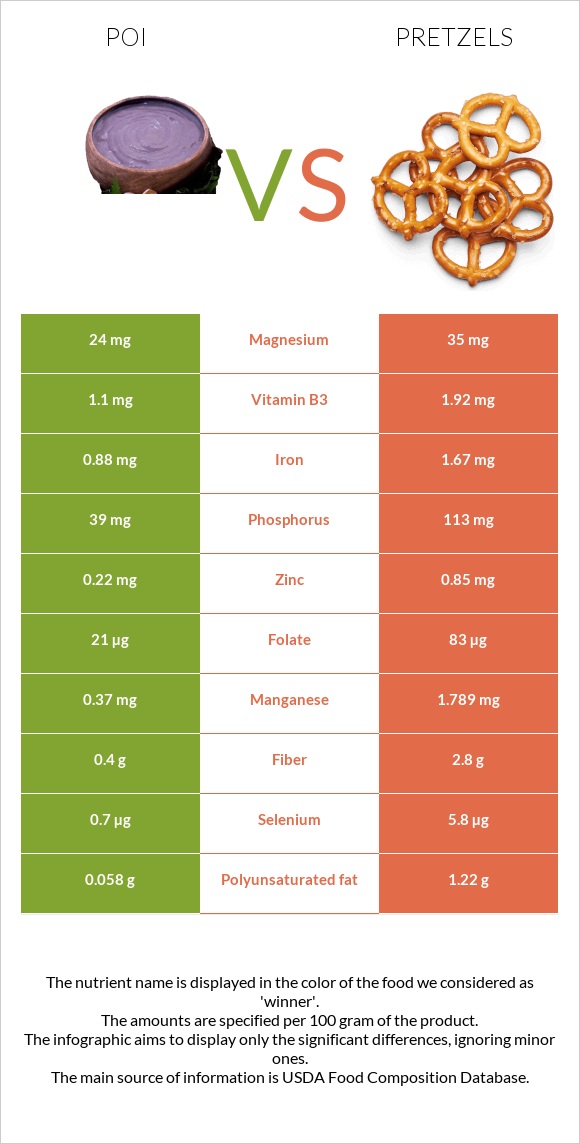
Differences between poi and pretzels Poi has more vitamin B6, while pretzels have more manganese, folate, copper, phosphorus, iron, fiber, selenium, and zinc. Pretzels' daily need coverage for sodium is 74% higher. Pretzels contain 2 times less vitamin B6 than poi. Poi contains 0.273mg of vitamin B6, while pretzels contain 0.116mg. The amount of sodium in poi is lower. The food types used in this comparison are Poi and Snacks, pretzels, hard, plain, made with unenriched flour, salted .
Infographic
Mineral Comparison
Mineral comparison score is based on the number of minerals by which one or the other food is richer. The "coverage" charts below show how much of the daily needs can be covered by 300 grams of the food.
2
100 g
300 g
1 cup - 240g
Magnesium
Magnesium
Calcium
Calcium
Potassium
Potassium
Iron
Iron
Copper
Copper
Zinc
Zinc
Phosphorus
Phosphorus
Sodium
Sodium
Manganese
Manganese
Selenium
Selenium
17%
4.8%
16%
33%
55%
6%
17%
1.6%
48%
3.8%
8
100 g
300 g
1 oz - 28.35g 10 twists - 60g
Magnesium
Magnesium
Calcium
Calcium
Potassium
Potassium
Iron
Iron
Copper
Copper
Zinc
Zinc
Phosphorus
Phosphorus
Sodium
Sodium
Manganese
Manganese
Selenium
Selenium
25%
11%
13%
63%
88%
23%
48%
224%
233%
32%
Vitamin Comparison
Vitamin comparison score is based on the number of vitamins by which one or the other food is richer. The "coverage" charts below show how much of the daily needs can be covered by 300 grams of the food.
5
100 g
300 g
1 cup - 240g
Vitamin C
Vit. C
Vitamin D
Vit. D
Vitamin A
Vit. A
Vitamin E
Vit. E
Vitamin B1
Vit. B1
Vitamin B2
Vit. B2
Vitamin B3
Vit. B3
Vitamin B5
Vit. B5
Vitamin B6
Vit. B6
Vitamin B12
Vit. B12
Vitamin K
Vit. K
Folate
Folate
13%
0%
1%
46%
33%
9.2%
21%
18%
63%
0%
2.5%
16%
4
100 g
300 g
1 oz - 28.35g 10 twists - 60g
Vitamin C
Vit. C
Vitamin D
Vit. D
Vitamin A
Vit. A
Vitamin E
Vit. E
Vitamin B1
Vit. B1
Vitamin B2
Vit. B2
Vitamin B3
Vit. B3
Vitamin B5
Vit. B5
Vitamin B6
Vit. B6
Vitamin B12
Vit. B12
Vitamin K
Vit. K
Folate
Folate
0%
0%
0%
0%
45%
23%
36%
17%
27%
0%
0%
62%
All nutrients comparison - raw data values
Nutrient
DV% diff.
Sodium
12mg
1715mg
74%
Manganese
0.37mg
1.789mg
62%
Protein
0.38g
9.1g
17%
Carbs
27.23g
79.2g
17%
Folate
21µg
83µg
16%
Vitamin E
2.3mg
15%
Calories
112kcal
381kcal
13%
Vitamin B6
0.273mg
0.116mg
12%
Copper
0.166mg
0.264mg
11%
Phosphorus
39mg
113mg
11%
Iron
0.88mg
1.67mg
10%
Fiber
0.4g
2.8g
10%
Selenium
0.7µg
5.8µg
9%
Polyunsaturated fat
0.058g
1.22g
8%
Zinc
0.22mg
0.85mg
6%
Fats
0.14g
3.5g
5%
Vitamin B2
0.04mg
0.1mg
5%
Vitamin B3
1.1mg
1.92mg
5%
Vitamin C
4mg
0mg
4%
Vitamin B1
0.13mg
0.18mg
4%
Magnesium
24mg
35mg
3%
Choline
16.7mg
3%
Saturated fat
0.029g
0.75g
3%
Monounsaturated fat
0.011g
1.36g
3%
Calcium
16mg
36mg
2%
Potassium
183mg
146mg
1%
Vitamin K
1µg
1%
Protein per 100 calories
0.34g
2.4g
N/A
Calories per 10 g protein
2947kcal
419kcal
N/A
Weight per 100 calories
89g
26g
N/A
Unsaturated / Saturated Fat ratio
2.4
3.4
N/A
Net carbs
26.83g
76.4g
N/A
Sugar
0.39g
N/A
Vitamin A
3µg
0µg
0%
Vitamin B5
0.293mg
0.288mg
0%
Tryptophan
0.109mg
0%
Threonine
0.259mg
0%
Isoleucine
0.345mg
0%
Leucine
0.636mg
0%
Lysine
0.221mg
0%
Methionine
0.164mg
0%
Phenylalanine
0.453mg
0%
Valine
0.392mg
0%
Histidine
0.201mg
0%
Macronutrient Comparison
Macronutrient breakdown side-by-side comparison
1
27%
72%
Protein:
0.38 g
Fats:
0.14 g
Carbs:
27.23 g
Water:
71.64 g
Other:
0.61 g
4
9%
4%
79%
3%
5%
Protein:
9.1 g
Fats:
3.5 g
Carbs:
79.2 g
Water:
3.3 g
Other:
4.9 g
Contains
more
Water Water
+2070.9%
Contains
more
Protein Protein
+2294.7%
Contains
more
Fats Fats
+2400%
Contains
more
Carbs Carbs
+190.9%
Contains
more
Other Other
+703.3%
Fat Type Comparison
Fat type breakdown side-by-side comparison
1
30%
11%
59%
Saturated fat:
Sat. Fat
0.029 g
Monounsaturated fat:
Mono. Fat
0.011 g
Polyunsaturated fat:
Poly. Fat
0.058 g
2
23%
41%
37%
Saturated fat:
Sat. Fat
0.75 g
Monounsaturated fat:
Mono. Fat
1.36 g
Polyunsaturated fat:
Poly. Fat
1.22 g
Contains
less
Sat. Fat Saturated fat
-96.1%
Contains
more
Mono. Fat Monounsaturated fat
+12263.6%
Contains
more
Poly. Fat Polyunsaturated fat
+2003.4%