
Liver vs. Lemongrass — In-Depth Nutrition Comparison
Compare
Summary of differences between liver and lemongrass
- Liver has more vitamin B12, vitamin A, vitamin B2, iron, selenium, vitamin B5, protein, and vitamin B3, while lemongrass has more manganese.
- Liver covers your daily need for vitamin B12 778% more than lemongrass.
- The amount of cholesterol in lemongrass is lower.
These are the specific foods used in this comparison Pork, fresh, variety meats, and by-products, liver, cooked, braised and Lemon grass (citronella), raw.
Infographic
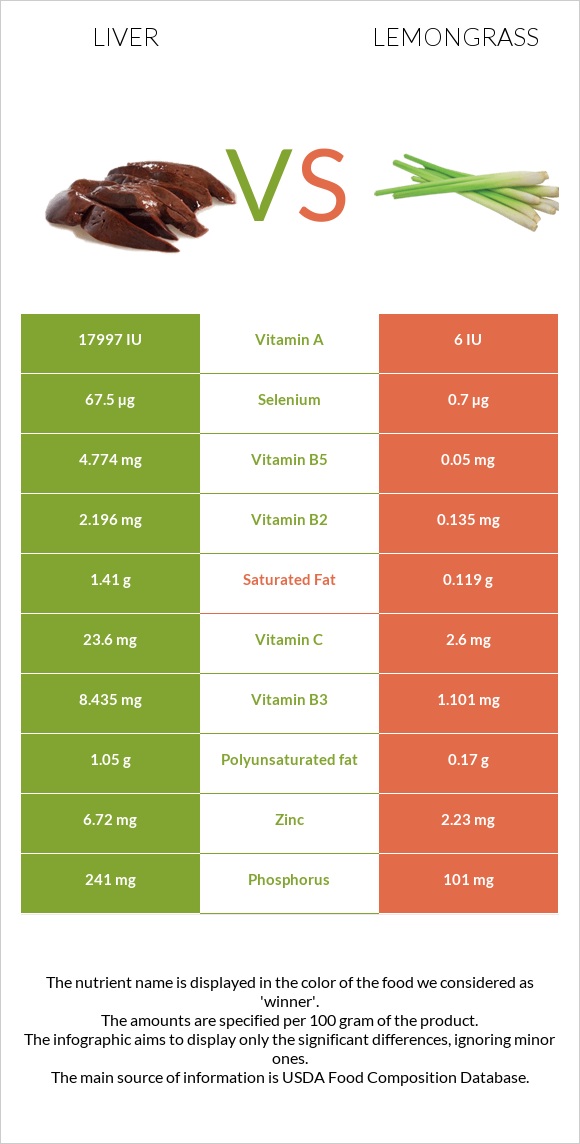
Infographic link
Mineral Comparison
The mineral comparison score is based on which food has a more favorable amount of each mineral. The �coverage� charts below show how much of the daily mineral needs are covered by the selected amount of each food.
| Contains more IronIron | +119.3% |
| Contains more CopperCopper | +138.3% |
| Contains more ZincZinc | +201.3% |
| Contains more PhosphorusPhosphorus | +138.6% |
| Contains more SeleniumSelenium | +9542.9% |
| Contains more MagnesiumMagnesium | +328.6% |
| Contains more CalciumCalcium | +550% |
| Contains more PotassiumPotassium | +382% |
| Contains less SodiumSodium | -87.8% |
| Contains more ManganeseManganese | +1641.3% |
Vitamin Comparison
The vitamin comparison score is based on the number of vitamins in which one food is richer than the other. The �coverage� charts below show how much of the daily vitamin needs are covered by the selected amount of each food.
| Contains more Vitamin CVitamin C | +807.7% |
| Contains more Vitamin AVitamin A | +∞% |
| Contains more Vitamin B1Vitamin B1 | +296.9% |
| Contains more Vitamin B2Vitamin B2 | +1526.7% |
| Contains more Vitamin B3Vitamin B3 | +666.1% |
| Contains more Vitamin B5Vitamin B5 | +9448% |
| Contains more Vitamin B6Vitamin B6 | +612.5% |
| Contains more Vitamin B12Vitamin B12 | +∞% |
| Contains more FolateFolate | +117.3% |
All nutrients comparison - raw data values
| Nutrient |  |
 |
DV% diff. |
| Vitamin B12 | 18.67µg | 0µg | 778% |
| Vitamin A | 5405µg | 0µg | 601% |
| Manganese | 0.3mg | 5.224mg | 214% |
| Vitamin B2 | 2.196mg | 0.135mg | 159% |
| Iron | 17.92mg | 8.17mg | 122% |
| Selenium | 67.5µg | 0.7µg | 121% |
| Cholesterol | 355mg | 0mg | 118% |
| Vitamin B5 | 4.774mg | 0.05mg | 94% |
| Protein | 26.02g | 1.82g | 48% |
| Vitamin B3 | 8.435mg | 1.101mg | 46% |
| Copper | 0.634mg | 0.266mg | 41% |
| Zinc | 6.72mg | 2.23mg | 41% |
| Vitamin B6 | 0.57mg | 0.08mg | 38% |
| Vitamin C | 23.6mg | 2.6mg | 23% |
| Folate | 163µg | 75µg | 22% |
| Phosphorus | 241mg | 101mg | 20% |
| Potassium | 150mg | 723mg | 17% |
| Vitamin B1 | 0.258mg | 0.065mg | 16% |
| Magnesium | 14mg | 60mg | 11% |
| Carbs | 3.76g | 25.31g | 7% |
| Fats | 4.4g | 0.49g | 6% |
| Calcium | 10mg | 65mg | 6% |
| Saturated fat | 1.41g | 0.119g | 6% |
| Polyunsaturated fat | 1.05g | 0.17g | 6% |
| Calories | 165kcal | 99kcal | 3% |
| Sodium | 49mg | 6mg | 2% |
| Monounsaturated fat | 0.63g | 0.054g | 1% |
| Protein per 100 calories | 16g | 1.8g | N/A |
| Calories per 10 g protein | 63kcal | 544kcal | N/A |
| Weight per 100 calories | 61g | 101g | N/A |
| Unsaturated / Saturated Fat ratio | 1.2 | 1.9 | N/A |
| Net carbs | 3.76g | 25.31g | N/A |
| Tryptophan | 0.366mg | 0% | |
| Threonine | 1.107mg | 0% | |
| Isoleucine | 1.32mg | 0% | |
| Leucine | 2.319mg | 0% | |
| Lysine | 2.007mg | 0% | |
| Methionine | 0.645mg | 0% | |
| Phenylalanine | 1.274mg | 0% | |
| Valine | 1.607mg | 0% | |
| Histidine | 0.708mg | 0% | |
| Omega-3 (DHA) | 0.03g | N/A | |
| Omega-3 (DPA) | 0.04g | N/A |
Macronutrient Comparison
Macronutrient breakdown side-by-side comparison
Protein:
26.02 g
Fats:
4.4 g
Carbs:
3.76 g
Water:
64.32 g
Other:
1.5 g
Protein:
1.82 g
Fats:
0.49 g
Carbs:
25.31 g
Water:
70.58 g
Other:
1.8 g
| Contains more ProteinProtein | +1329.7% |
| Contains more FatsFats | +798% |
| Contains more CarbsCarbs | +573.1% |
~equal in
Water
~70.58g
Fat Type Comparison
Fat type breakdown side-by-side comparison
Saturated fat:
Sat. Fat
1.41 g
Monounsaturated fat:
Mono. Fat
0.63 g
Polyunsaturated fat:
Poly. Fat
1.05 g
Saturated fat:
Sat. Fat
0.119 g
Monounsaturated fat:
Mono. Fat
0.054 g
Polyunsaturated fat:
Poly. Fat
0.17 g
| Contains more Mono. FatMonounsaturated fat | +1066.7% |
| Contains more Poly. FatPolyunsaturated fat | +517.6% |
| Contains less Sat. FatSaturated fat | -91.6% |


