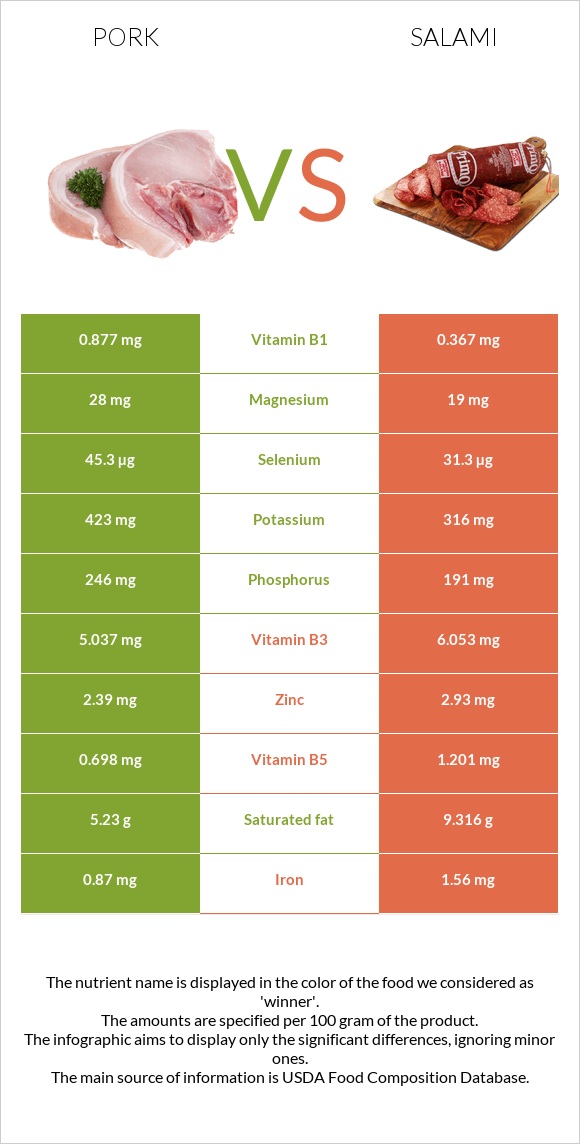
Differences between pork and salami Pork has more vitamin B1, selenium, and phosphorus, while salami has more manganese, vitamin B12, copper, vitamin B5, and iron. Salami's daily need coverage for sodium is 73% higher. Salami contains 2 times less vitamin B1 than pork. Pork contains 0.877mg of vitamin B1, while salami contains 0.367mg. The amount of saturated fat in pork is lower. Pork has a lower glycemic index. The glycemic index of pork is 0, while the glycemic index of salami is 28. The food types used in this comparison are Pork, fresh, loin, whole, separable lean, and fat, cooked, broiled and Salami, cooked, beef, and pork .
Infographic
Mineral Comparison
Mineral comparison score is based on the number of minerals by which one or the other food is richer. The "coverage" charts below show how much of the daily needs can be covered by 300 grams of the food.
6
100 g
300 g
3 oz - 85g 1 chop, excluding refuse (yield from 1 raw chop, with refuse, weighing 151 g) - 87g
Magnesium
Magnesium
Calcium
Calcium
Potassium
Potassium
Iron
Iron
Copper
Copper
Zinc
Zinc
Phosphorus
Phosphorus
Sodium
Sodium
Manganese
Manganese
Selenium
Selenium
20%
5.7%
37%
33%
24%
65%
105%
8.1%
1.2%
247%
4
100 g
300 g
1 slice round - 12.3g
Magnesium
Magnesium
Calcium
Calcium
Potassium
Potassium
Iron
Iron
Copper
Copper
Zinc
Zinc
Phosphorus
Phosphorus
Sodium
Sodium
Manganese
Manganese
Selenium
Selenium
14%
4.5%
28%
59%
119%
80%
82%
227%
128%
171%
Vitamin Comparison
Vitamin comparison score is based on the number of vitamins by which one or the other food is richer. The "coverage" charts below show how much of the daily needs can be covered by 300 grams of the food.
6
100 g
300 g
3 oz - 85g 1 chop, excluding refuse (yield from 1 raw chop, with refuse, weighing 151 g) - 87g
Vitamin C
Vit. C
Vitamin D
Vit. D
Vitamin A
Vit. A
Vitamin E
Vit. E
Vitamin B1
Vit. B1
Vitamin B2
Vit. B2
Vitamin B3
Vit. B3
Vitamin B5
Vit. B5
Vitamin B6
Vit. B6
Vitamin B12
Vit. B12
Vitamin K
Vit. K
Folate
Folate
2%
20%
0.67%
5.8%
219%
74%
94%
42%
107%
88%
0%
3.8%
5
100 g
300 g
1 slice round - 12.3g
Vitamin C
Vit. C
Vitamin D
Vit. D
Vitamin A
Vit. A
Vitamin E
Vit. E
Vitamin B1
Vit. B1
Vitamin B2
Vit. B2
Vitamin B3
Vit. B3
Vitamin B5
Vit. B5
Vitamin B6
Vit. B6
Vitamin B12
Vit. B12
Vitamin K
Vit. K
Folate
Folate
0%
15%
0%
4.4%
92%
82%
113%
72%
106%
190%
8%
2.3%
All nutrients comparison - raw data values
Nutrient
DV% diff.
Sodium
62mg
1740mg
73%
Vitamin B1
0.877mg
0.367mg
43%
Manganese
0.009mg
0.978mg
42%
Vitamin B12
0.7µg
1.52µg
34%
Copper
0.073mg
0.357mg
32%
Selenium
45.3µg
31.3µg
25%
Saturated fat
5.23g
9.316g
19%
Fats
13.92g
25.9g
18%
Monounsaturated fat
6.19g
11.127g
12%
Protein
27.32g
21.85g
11%
Vitamin B5
0.698mg
1.201mg
10%
Iron
0.87mg
1.56mg
9%
Polyunsaturated fat
1.2g
2.529g
9%
Phosphorus
246mg
191mg
8%
Vitamin B3
5.037mg
6.053mg
6%
Calories
242kcal
336kcal
5%
Zinc
2.39mg
2.93mg
5%
Cholesterol
80mg
89mg
3%
Potassium
423mg
316mg
3%
Vitamin B2
0.321mg
0.357mg
3%
Vitamin K
0µg
3.2µg
3%
Vitamin D*
53 IU
41 IU
2%
Vitamin D
1.3µg
1µg
2%
Magnesium
28mg
19mg
2%
Vitamin C
0.6mg
0mg
1%
Carbs
0g
2.4g
1%
Folate
5µg
3µg
1%
Protein per 100 calories
11g
6.5g
N/A
Calories per 10 g protein
89kcal
154kcal
N/A
Weight per 100 calories
41g
30g
N/A
Unsaturated / Saturated Fat ratio
1.4
1.5
N/A
Net carbs
0g
2.4g
N/A
Calcium
19mg
15mg
0%
Sugar
0g
0.96g
N/A
Vitamin A
2µg
0µg
0%
Vitamin E
0.29mg
0.22mg
0%
Vitamin B6
0.464mg
0.459mg
0%
Trans fat
0.586g
N/A
Choline
93.9mg
93.5mg
0%
Tryptophan
0.338mg
0.114mg
0%
Threonine
1.234mg
0.521mg
0%
Isoleucine
1.26mg
0.675mg
0%
Leucine
2.177mg
0.929mg
0%
Lysine
2.446mg
1.107mg
0%
Methionine
0.712mg
0.301mg
0%
Phenylalanine
1.086mg
0.481mg
0%
Valine
1.473mg
0.668mg
0%
Histidine
1.067mg
0.359mg
0%
Omega-3 - ALA
0.126g
N/A
Omega-6 - Eicosadienoic acid
0.084g
N/A
Omega-6 - Linoleic acid
2.104g
N/A
Macronutrient Comparison
Macronutrient breakdown side-by-side comparison
2
27%
14%
58%
Protein:
27.32 g
Fats:
13.92 g
Carbs:
0 g
Water:
57.87 g
Other:
0.89 g
3
22%
26%
2%
45%
5%
Protein:
21.85 g
Fats:
25.9 g
Carbs:
2.4 g
Water:
45.19 g
Other:
4.66 g
Contains
more
Protein Protein
+25%
Contains
more
Water Water
+28.1%
Contains
more
Fats Fats
+86.1%
Contains
more
Carbs Carbs
+∞%
Contains
more
Other Other
+423.6%
Fat Type Comparison
Fat type breakdown side-by-side comparison
1
41%
49%
10%
Saturated fat:
Sat. Fat
5.23 g
Monounsaturated fat:
Mono. Fat
6.19 g
Polyunsaturated fat:
Poly. Fat
1.2 g
2
41%
48%
11%
Saturated fat:
Sat. Fat
9.316 g
Monounsaturated fat:
Mono. Fat
11.127 g
Polyunsaturated fat:
Poly. Fat
2.529 g
Contains
less
Sat. Fat Saturated fat
-43.9%
Contains
more
Mono. Fat Monounsaturated fat
+79.8%
Contains
more
Poly. Fat Polyunsaturated fat
+110.8%