
Raisin Bran Cereal vs. Bran cereal — In-Depth Nutrition Comparison
Compare
A recap on the differences between raisin Bran Cereal and bran cereal
- Raisin Bran Cereal has less vitamin B6, vitamin B12, folate, vitamin B2, vitamin B1, phosphorus, fiber, copper, zinc, and magnesium.
- Bran cereal covers your daily vitamin B6 needs 858% more than raisin Bran Cereal.
Food varieties used in this article are Cereals ready-to-eat, MALT-O-MEAL, Raisin Bran Cereal and Cereals ready-to-eat, KELLOGG, KELLOGG'S ALL-BRAN Original.
Infographic
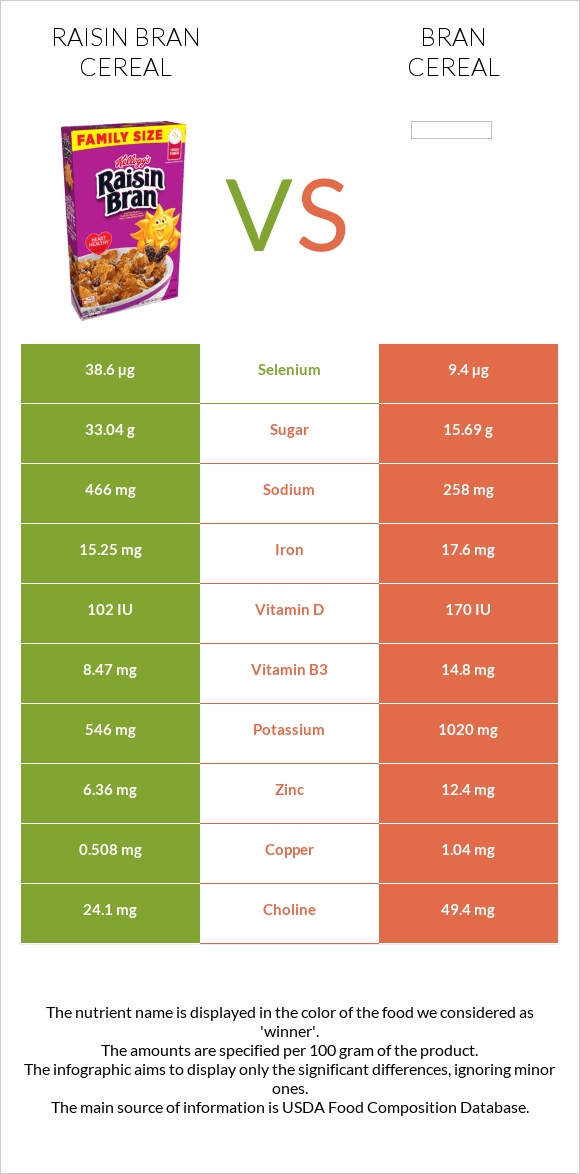
Infographic link
Mineral Comparison
The mineral comparison score is based on which food has a more favorable amount of each mineral. The �coverage� charts below show how much of the daily mineral needs are covered by the selected amount of each food.
| Contains more SeleniumSelenium | +310.6% |
| Contains more MagnesiumMagnesium | +166.2% |
| Contains more CalciumCalcium | +1078.8% |
| Contains more PotassiumPotassium | +86.8% |
| Contains more IronIron | +15.4% |
| Contains more CopperCopper | +104.7% |
| Contains more ZincZinc | +95% |
| Contains more PhosphorusPhosphorus | +239.2% |
| Contains less SodiumSodium | -44.6% |
| Contains more ManganeseManganese | +∞% |
Vitamin Comparison
The vitamin comparison score is based on the number of vitamins in which one food is richer than the other. The �coverage� charts below show how much of the daily vitamin needs are covered by the selected amount of each food.
| Contains more Vitamin CVitamin C | +∞% |
| Contains more Vitamin DVitamin D | +72% |
| Contains more Vitamin AVitamin A | +106.3% |
| Contains more Vitamin EVitamin E | +561.1% |
| Contains more Vitamin B1Vitamin B1 | +260.3% |
| Contains more Vitamin B2Vitamin B2 | +276.4% |
| Contains more Vitamin B3Vitamin B3 | +74.7% |
| Contains more Vitamin B5Vitamin B5 | +∞% |
| Contains more Vitamin B6Vitamin B6 | +1311.8% |
| Contains more Vitamin B12Vitamin B12 | +643.1% |
| Contains more Vitamin KVitamin K | +1633.3% |
| Contains more FolateFolate | +286.4% |
All nutrients comparison - raw data values
| Nutrient |  |
 |
DV% diff. |
| Vitamin B6 | 0.85mg | 12mg | 858% |
| Vitamin B12 | 2.53µg | 18.8µg | 678% |
| Manganese | 7.41mg | 322% | |
| Folate | 339µg | 1310µg | 243% |
| Vitamin B2 | 0.72mg | 2.71mg | 153% |
| Vitamin B1 | 0.63mg | 2.27mg | 137% |
| Phosphorus | 339mg | 1150mg | 116% |
| Fiber | 10.2g | 29.3g | 76% |
| Copper | 0.508mg | 1.04mg | 59% |
| Zinc | 6.36mg | 12.4mg | 55% |
| Magnesium | 136mg | 362mg | 54% |
| Selenium | 38.6µg | 9.4µg | 53% |
| Vitamin B3 | 8.47mg | 14.8mg | 40% |
| Calcium | 33mg | 389mg | 36% |
| Vitamin A | 253µg | 522µg | 30% |
| Iron | 15.25mg | 17.6mg | 29% |
| Vitamin C | 0mg | 20mg | 22% |
| Vitamin B5 | 1.06mg | 21% | |
| Potassium | 546mg | 1020mg | 14% |
| Protein | 7.63g | 13.14g | 11% |
| Vitamin D* | 102 IU | 170 IU | 9% |
| Vitamin D | 2.5µg | 4.3µg | 9% |
| Starch | 21.8g | 9% | |
| Sodium | 466mg | 258mg | 9% |
| Vitamin E | 0.18mg | 1.19mg | 7% |
| Polyunsaturated fat | 0.908g | 2g | 7% |
| Fats | 1.87g | 4.9g | 5% |
| Choline | 24.1mg | 49.4mg | 5% |
| Calories | 342kcal | 259kcal | 4% |
| Vitamin K | 0.3µg | 5.2µg | 4% |
| Saturated fat | 0.424g | 1.1g | 3% |
| Carbs | 80.37g | 74.24g | 2% |
| Monounsaturated fat | 0.357g | 0.89g | 1% |
| Protein per 100 calories | 2.2g | 5.1g | N/A |
| Calories per 10 g protein | 448kcal | 197kcal | N/A |
| Weight per 100 calories | 29g | 39g | N/A |
| Unsaturated / Saturated Fat ratio | 3 | 2.6 | N/A |
| Net carbs | 70.17g | 44.94g | N/A |
| Sugar | 33.04g | 15.69g | N/A |
| Tryptophan | 0.22mg | 0% | |
| Threonine | 0.38mg | 0% | |
| Isoleucine | 0.35mg | 0% | |
| Leucine | 0.7mg | 0% | |
| Lysine | 0.35mg | 0% | |
| Methionine | 0.17mg | 0% | |
| Phenylalanine | 0.48mg | 0% | |
| Valine | 0.52mg | 0% | |
| Histidine | 0.28mg | 0% | |
| Fructose | 0.36g | 0% |
Macronutrient Comparison
Macronutrient breakdown side-by-side comparison
Protein:
7.63 g
Fats:
1.87 g
Carbs:
80.37 g
Water:
7.5 g
Other:
2.63 g
Protein:
13.14 g
Fats:
4.9 g
Carbs:
74.24 g
Water:
2.12 g
Other:
5.6 g
| Contains more WaterWater | +253.8% |
| Contains more ProteinProtein | +72.2% |
| Contains more FatsFats | +162% |
~equal in
Carbs
~74.24g
Fat Type Comparison
Fat type breakdown side-by-side comparison
Saturated fat:
Sat. Fat
0.424 g
Monounsaturated fat:
Mono. Fat
0.357 g
Polyunsaturated fat:
Poly. Fat
0.908 g
Saturated fat:
Sat. Fat
1.1 g
Monounsaturated fat:
Mono. Fat
0.89 g
Polyunsaturated fat:
Poly. Fat
2 g
| Contains less Sat. FatSaturated fat | -61.5% |
| Contains more Mono. FatMonounsaturated fat | +149.3% |
| Contains more Poly. FatPolyunsaturated fat | +120.3% |


