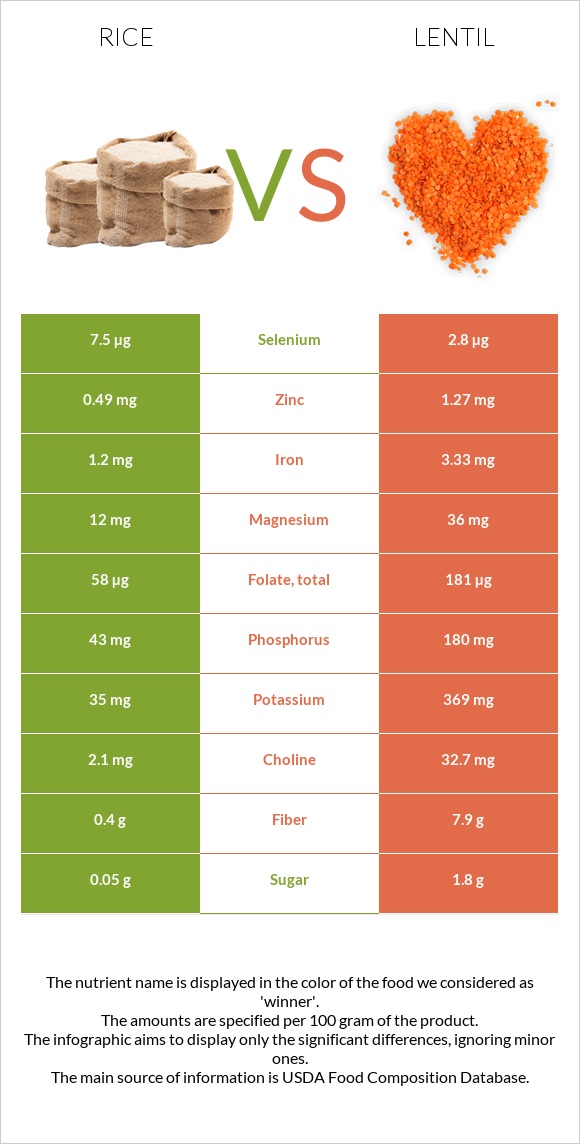
A recap on the differences between rice and lentil Rice has more selenium; however, lentil is higher in folate, fiber, iron, copper, phosphorus, potassium, zinc, vitamin B6, and magnesium. Lentil covers your daily folate needs 31% more than rice. Lentil contains 3 times less selenium than rice. Rice contains 7.5µg of selenium, while lentil contains 2.8µg. The glycemic index of rice is higher. Food varieties used in this article are Rice, white, long-grain, regular, enriched, cooked and Lentils, mature seeds, cooked, boiled, without salt .
Infographic
Mineral Comparison
Mineral comparison score is based on the number of minerals by which one or the other food is richer. The "coverage" charts below show how much of the daily needs can be covered by 300 grams of the food.
2
100 g
300 g
1 cup - 158g
Magnesium
Magnesium
Calcium
Calcium
Potassium
Potassium
Iron
Iron
Copper
Copper
Zinc
Zinc
Phosphorus
Phosphorus
Sodium
Sodium
Manganese
Manganese
Selenium
Selenium
8.6%
3%
3.1%
45%
23%
13%
18%
0.13%
62%
41%
7
100 g
300 g
1 tbsp - 12.3g 1 cup - 198g
Magnesium
Magnesium
Calcium
Calcium
Potassium
Potassium
Iron
Iron
Copper
Copper
Zinc
Zinc
Phosphorus
Phosphorus
Sodium
Sodium
Manganese
Manganese
Selenium
Selenium
26%
5.7%
33%
125%
84%
35%
77%
0.26%
64%
15%
Vitamin Comparison
Vitamin comparison score is based on the number of vitamins by which one or the other food is richer. The "coverage" charts below show how much of the daily needs can be covered by 300 grams of the food.
1
100 g
300 g
1 cup - 158g
Vitamin C
Vit. C
Vitamin D
Vit. D
Vitamin A
Vit. A
Vitamin E
Vit. E
Vitamin B1
Vit. B1
Vitamin B2
Vit. B2
Vitamin B3
Vit. B3
Vitamin B5
Vit. B5
Vitamin B6
Vit. B6
Vitamin B12
Vit. B12
Vitamin K
Vit. K
Folate
Folate
0%
0%
0%
0.8%
41%
3%
28%
23%
21%
0%
0%
44%
7
100 g
300 g
1 tbsp - 12.3g 1 cup - 198g
Vitamin C
Vit. C
Vitamin D
Vit. D
Vitamin A
Vit. A
Vitamin E
Vit. E
Vitamin B1
Vit. B1
Vitamin B2
Vit. B2
Vitamin B3
Vit. B3
Vitamin B5
Vit. B5
Vitamin B6
Vit. B6
Vitamin B12
Vit. B12
Vitamin K
Vit. K
Folate
Folate
5%
0%
0%
2.2%
42%
17%
20%
38%
41%
0%
4.3%
136%
All nutrients comparison - raw data values
Nutrient
DV% diff.
Folate
58µg
181µg
31%
Fiber
0.4g
7.9g
30%
Iron
1.2mg
3.33mg
27%
Copper
0.069mg
0.251mg
20%
Phosphorus
43mg
180mg
20%
Protein
2.69g
9.02g
13%
Potassium
35mg
369mg
10%
Selenium
7.5µg
2.8µg
9%
Zinc
0.49mg
1.27mg
7%
Vitamin B6
0.093mg
0.178mg
7%
Magnesium
12mg
36mg
6%
Choline
2.1mg
32.7mg
6%
Vitamin B2
0.013mg
0.073mg
5%
Vitamin B5
0.39mg
0.638mg
5%
Carbs
28.17g
20.13g
3%
Vitamin B3
1.476mg
1.06mg
3%
Vitamin C
0mg
1.5mg
2%
Calories
130kcal
116kcal
1%
Calcium
10mg
19mg
1%
Manganese
0.472mg
0.494mg
1%
Vitamin B1
0.163mg
0.169mg
1%
Vitamin K
0µg
1.7µg
1%
Polyunsaturated fat
0.076g
0.175g
1%
Protein per 100 calories
2.1g
7.8g
N/A
Calories per 10 g protein
483kcal
129kcal
N/A
Weight per 100 calories
77g
86g
N/A
Fats
0.28g
0.38g
0%
Net carbs
27.77g
12.23g
N/A
Sugar
0.05g
1.8g
N/A
Sodium
1mg
2mg
0%
Vitamin E
0.04mg
0.11mg
0%
Saturated fat
0.077g
0.053g
0%
Monounsaturated fat
0.088g
0.064g
0%
Tryptophan
0.031mg
0.081mg
0%
Threonine
0.096mg
0.323mg
0%
Isoleucine
0.116mg
0.39mg
0%
Leucine
0.222mg
0.654mg
0%
Lysine
0.097mg
0.63mg
0%
Methionine
0.063mg
0.077mg
0%
Phenylalanine
0.144mg
0.445mg
0%
Valine
0.164mg
0.448mg
0%
Histidine
0.063mg
0.254mg
0%
Macronutrient Comparison
Macronutrient breakdown side-by-side comparison
1
3%
28%
68%
Protein:
2.69 g
Fats:
0.28 g
Carbs:
28.17 g
Water:
68.44 g
Other:
0.42 g
4
9%
20%
70%
Protein:
9.02 g
Fats:
0.38 g
Carbs:
20.13 g
Water:
69.64 g
Other:
0.83 g
Contains
more
Carbs Carbs
+39.9%
Contains
more
Protein Protein
+235.3%
Contains
more
Fats Fats
+35.7%
Contains
more
Other Other
+97.6%
Fat Type Comparison
Fat type breakdown side-by-side comparison
1
32%
37%
32%
Saturated fat:
Sat. Fat
0.077 g
Monounsaturated fat:
Mono. Fat
0.088 g
Polyunsaturated fat:
Poly. Fat
0.076 g
2
18%
22%
60%
Saturated fat:
Sat. Fat
0.053 g
Monounsaturated fat:
Mono. Fat
0.064 g
Polyunsaturated fat:
Poly. Fat
0.175 g
Contains
more
Mono. Fat Monounsaturated fat
+37.5%
Contains
less
Sat. Fat Saturated fat
-31.2%
Contains
more
Poly. Fat Polyunsaturated fat
+130.3%