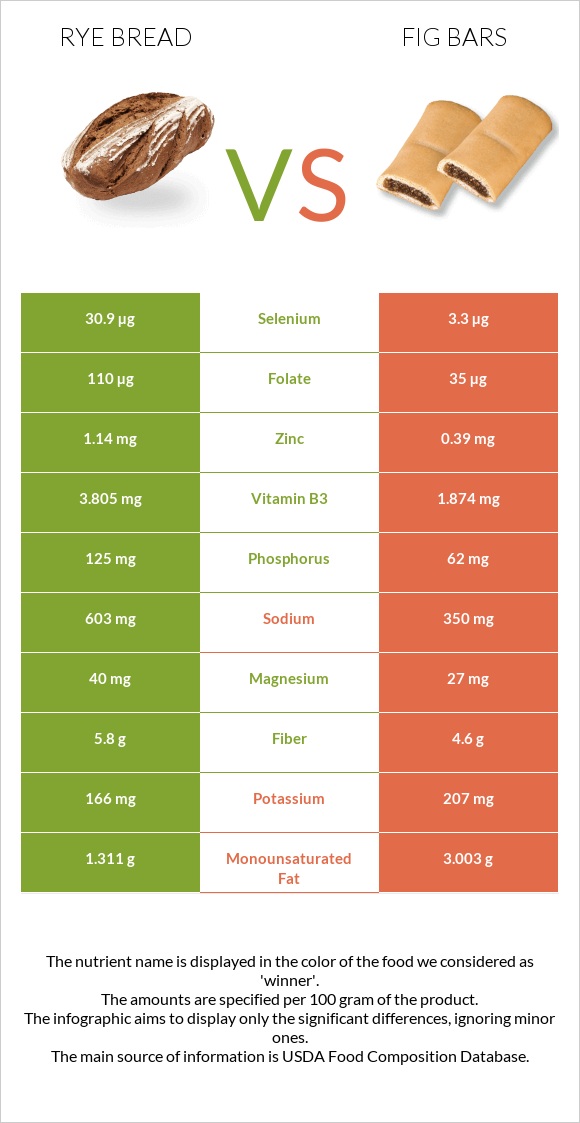
Significant differences between rye bread and fig bars Rye bread is richer than fig bars in selenium, vitamin B1, manganese, folate, vitamin B3, vitamin B2, phosphorus, and zinc. Rye bread covers your daily selenium needs 50% more than fig bars. Rye bread has 3 times more folate than fig bars. Rye bread has 110µg of folate, while fig bars have 35µg. Fig bars are lower in sodium. Specific food types used in this comparison are Bread, rye and Cookies, fig bars .
Infographic
Mineral Comparison
Mineral comparison score is based on the number of minerals by which one or the other food is richer. The "coverage" charts below show how much of the daily needs can be covered by 300 grams of the food.
7
100 g
300 g
1 slice, snack-size - 7g 1 slice, thin - 25g 1 oz - 28.35g 1 slice, regular - 32g
Magnesium
Magnesium
Calcium
Calcium
Potassium
Potassium
Iron
Iron
Copper
Copper
Zinc
Zinc
Phosphorus
Phosphorus
Sodium
Sodium
Manganese
Manganese
Selenium
Selenium
29%
22%
15%
106%
62%
31%
54%
79%
107%
169%
2
100 g
300 g
1 cookie - 16g 1 oz - 28.35g 1 Figaroo (2 square halves) - 43g 1 individual package (2 oz package containing 2 3" bars) - 57g
Magnesium
Magnesium
Calcium
Calcium
Potassium
Potassium
Iron
Iron
Copper
Copper
Zinc
Zinc
Phosphorus
Phosphorus
Sodium
Sodium
Manganese
Manganese
Selenium
Selenium
19%
19%
18%
109%
49%
11%
27%
46%
45%
18%
Vitamin Comparison
Vitamin comparison score is based on the number of vitamins by which one or the other food is richer. The "coverage" charts below show how much of the daily needs can be covered by 300 grams of the food.
6
100 g
300 g
1 slice, snack-size - 7g 1 slice, thin - 25g 1 oz - 28.35g 1 slice, regular - 32g
Vitamin C
Vit. C
Vitamin D
Vit. D
Vitamin A
Vit. A
Vitamin E
Vit. E
Vitamin B1
Vit. B1
Vitamin B2
Vit. B2
Vitamin B3
Vit. B3
Vitamin B5
Vit. B5
Vitamin B6
Vit. B6
Vitamin B12
Vit. B12
Vitamin K
Vit. K
Folate
Folate
1.3%
0%
0%
6.6%
109%
77%
71%
26%
17%
0%
3%
83%
4
100 g
300 g
1 cookie - 16g 1 oz - 28.35g 1 Figaroo (2 square halves) - 43g 1 individual package (2 oz package containing 2 3" bars) - 57g
Vitamin C
Vit. C
Vitamin D
Vit. D
Vitamin A
Vit. A
Vitamin E
Vit. E
Vitamin B1
Vit. B1
Vitamin B2
Vit. B2
Vitamin B3
Vit. B3
Vitamin B5
Vit. B5
Vitamin B6
Vit. B6
Vitamin B12
Vit. B12
Vitamin K
Vit. K
Folate
Folate
1%
0%
3%
13%
40%
50%
35%
22%
17%
11%
15%
26%
All nutrients comparison - raw data values
Nutrient
DV% diff.
Selenium
30.9µg
3.3µg
50%
Vitamin B1
0.434mg
0.158mg
23%
Manganese
0.824mg
0.343mg
21%
Folate
110µg
35µg
19%
Polyunsaturated fat
0.799g
2.772g
13%
Vitamin B3
3.805mg
1.874mg
12%
Sodium
603mg
350mg
11%
Protein
8.5g
3.7g
10%
Phosphorus
125mg
62mg
9%
Vitamin B2
0.335mg
0.217mg
9%
Carbs
48.3g
70.9g
8%
Zinc
1.14mg
0.39mg
7%
Fats
3.3g
7.3g
6%
Fiber
5.8g
4.6g
5%
Calories
259kcal
348kcal
4%
Copper
0.186mg
0.147mg
4%
Vitamin B12
0µg
0.09µg
4%
Vitamin K
1.2µg
5.8µg
4%
Monounsaturated fat
1.311g
3.003g
4%
Magnesium
40mg
27mg
3%
Vitamin E
0.33mg
0.65mg
2%
Vitamin B5
0.44mg
0.364mg
2%
Saturated fat
0.626g
1.123g
2%
Calcium
73mg
64mg
1%
Potassium
166mg
207mg
1%
Iron
2.83mg
2.9mg
1%
Vitamin A
0µg
9µg
1%
Protein per 100 calories
3.3g
1.1g
N/A
Calories per 10 g protein
305kcal
941kcal
N/A
Weight per 100 calories
39g
29g
N/A
Unsaturated / Saturated Fat ratio
3.4
5.1
N/A
Vitamin C
0.4mg
0.3mg
0%
Net carbs
42.5g
66.3g
N/A
Sugar
3.85g
46.36g
N/A
Vitamin B6
0.075mg
0.075mg
0%
Choline
14.6mg
14.6mg
0%
Tryptophan
0.096mg
0.046mg
0%
Threonine
0.255mg
0.113mg
0%
Isoleucine
0.319mg
0.132mg
0%
Leucine
0.579mg
0.224mg
0%
Lysine
0.233mg
0.14mg
0%
Methionine
0.139mg
0.053mg
0%
Phenylalanine
0.411mg
0.145mg
0%
Valine
0.379mg
0.155mg
0%
Histidine
0.182mg
0.067mg
0%
Macronutrient Comparison
Macronutrient breakdown side-by-side comparison
3
9%
3%
48%
37%
3%
Protein:
8.5 g
Fats:
3.3 g
Carbs:
48.3 g
Water:
37.3 g
Other:
2.6 g
2
4%
7%
71%
17%
Protein:
3.7 g
Fats:
7.3 g
Carbs:
70.9 g
Water:
16.5 g
Other:
1.6 g
Contains
more
Protein Protein
+129.7%
Contains
more
Water Water
+126.1%
Contains
more
Other Other
+62.5%
Contains
more
Fats Fats
+121.2%
Contains
more
Carbs Carbs
+46.8%
Fat Type Comparison
Fat type breakdown side-by-side comparison
1
23%
48%
29%
Saturated fat:
Sat. Fat
0.626 g
Monounsaturated fat:
Mono. Fat
1.311 g
Polyunsaturated fat:
Poly. Fat
0.799 g
2
16%
44%
40%
Saturated fat:
Sat. Fat
1.123 g
Monounsaturated fat:
Mono. Fat
3.003 g
Polyunsaturated fat:
Poly. Fat
2.772 g
Contains
less
Sat. Fat Saturated fat
-44.3%
Contains
more
Mono. Fat Monounsaturated fat
+129.1%
Contains
more
Poly. Fat Polyunsaturated fat
+246.9%