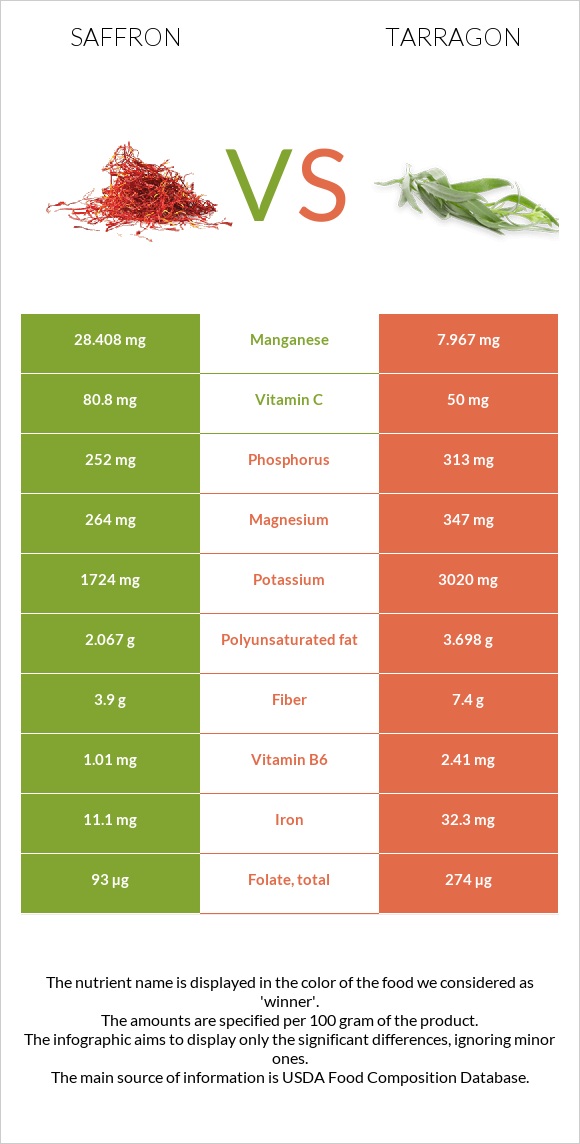
How are saffron and tarragon different? Saffron is richer in manganese, while tarragon is higher in iron, vitamin B6, calcium, vitamin B2, vitamin A, vitamin B3, folate, copper, and potassium. Saffron covers your daily need for manganese, 889% more than tarragon. Saffron has a higher glycemic index (70) than tarragon (0). Spices, saffron and Spices, tarragon, dried types were used in this article.
Infographic
Mineral Comparison
Mineral comparison score is based on the number of minerals by which one or the other food is richer. The "coverage" charts below show how much of the daily needs can be covered by 300 grams of the food.
2
100 g
300 g
0.25 tsp - 0.5g 1 tbsp - 2.1g
Magnesium
Magnesium
Calcium
Calcium
Potassium
Potassium
Iron
Iron
Copper
Copper
Zinc
Zinc
Phosphorus
Phosphorus
Sodium
Sodium
Manganese
Manganese
Selenium
Selenium
189%
33%
152%
416%
109%
30%
108%
19%
3705%
31%
8
100 g
300 g
0.25 tsp - 0.5g 1 tsp, ground - 1.6g 1 tbsp, leaves - 1.8g 1 tbsp, ground - 4.8g
Magnesium
Magnesium
Calcium
Calcium
Potassium
Potassium
Iron
Iron
Copper
Copper
Zinc
Zinc
Phosphorus
Phosphorus
Sodium
Sodium
Manganese
Manganese
Selenium
Selenium
248%
342%
266%
1211%
226%
106%
134%
8.1%
1039%
24%
Vitamin Comparison
Vitamin comparison score is based on the number of vitamins by which one or the other food is richer. The "coverage" charts below show how much of the daily needs can be covered by 300 grams of the food.
1
100 g
300 g
0.25 tsp - 0.5g 1 tbsp - 2.1g
Vitamin C
Vit. C
Vitamin D
Vit. D
Vitamin A
Vit. A
Vitamin E
Vit. E
Vitamin B1
Vit. B1
Vitamin B2
Vit. B2
Vitamin B3
Vit. B3
Vitamin B5
Vit. B5
Vitamin B6
Vit. B6
Vitamin B12
Vit. B12
Vitamin K
Vit. K
Folate
Folate
269%
0%
9%
0%
29%
62%
27%
0%
233%
0%
0%
70%
6
100 g
300 g
0.25 tsp - 0.5g 1 tsp, ground - 1.6g 1 tbsp, leaves - 1.8g 1 tbsp, ground - 4.8g
Vitamin C
Vit. C
Vitamin D
Vit. D
Vitamin A
Vit. A
Vitamin E
Vit. E
Vitamin B1
Vit. B1
Vitamin B2
Vit. B2
Vitamin B3
Vit. B3
Vitamin B5
Vit. B5
Vitamin B6
Vit. B6
Vitamin B12
Vit. B12
Vitamin K
Vit. K
Folate
Folate
167%
0%
70%
0%
63%
309%
168%
0%
556%
0%
0%
206%
All nutrients comparison - raw data values
Nutrient
DV% diff.
Manganese
28.408mg
7.967mg
889%
Iron
11.1mg
32.3mg
265%
Vitamin B6
1.01mg
2.41mg
108%
Calcium
111mg
1139mg
103%
Vitamin B2
0.267mg
1.339mg
82%
Vitamin B3
1.46mg
8.95mg
47%
Folate
93µg
274µg
45%
Copper
0.328mg
0.677mg
39%
Potassium
1724mg
3020mg
38%
Vitamin C
80.8mg
50mg
34%
Zinc
1.09mg
3.9mg
26%
Protein
11.43g
22.77g
23%
Magnesium
264mg
347mg
20%
Vitamin A
27µg
210µg
20%
Fiber
3.9g
7.4g
14%
Vitamin B1
0.115mg
0.251mg
11%
Polyunsaturated fat
2.067g
3.698g
11%
Phosphorus
252mg
313mg
9%
Carbs
65.37g
50.22g
5%
Sodium
148mg
62mg
4%
Fats
5.85g
7.24g
2%
Selenium
5.6µg
4.4µg
2%
Calories
310kcal
295kcal
1%
Saturated fat
1.586g
1.881g
1%
Protein per 100 calories
3.7g
7.7g
N/A
Calories per 10 g protein
271kcal
130kcal
N/A
Weight per 100 calories
32g
34g
N/A
Unsaturated / Saturated Fat ratio
1.6
2.2
N/A
Net carbs
61.47g
42.82g
N/A
Monounsaturated fat
0.429g
0.474g
0%
Omega-3 - DPA
0.006g
0g
N/A
Macronutrient Comparison
Macronutrient breakdown side-by-side comparison
2
11%
6%
65%
12%
5%
Protein:
11.43 g
Fats:
5.85 g
Carbs:
65.37 g
Water:
11.9 g
Other:
5.45 g
3
23%
7%
50%
8%
12%
Protein:
22.77 g
Fats:
7.24 g
Carbs:
50.22 g
Water:
7.74 g
Other:
12.03 g
Contains
more
Carbs Carbs
+30.2%
Contains
more
Water Water
+53.7%
Contains
more
Protein Protein
+99.2%
Contains
more
Fats Fats
+23.8%
Contains
more
Other Other
+120.7%
Fat Type Comparison
Fat type breakdown side-by-side comparison
1
39%
11%
51%
Saturated fat:
Sat. Fat
1.586 g
Monounsaturated fat:
Mono. Fat
0.429 g
Polyunsaturated fat:
Poly. Fat
2.067 g
2
31%
8%
61%
Saturated fat:
Sat. Fat
1.881 g
Monounsaturated fat:
Mono. Fat
0.474 g
Polyunsaturated fat:
Poly. Fat
3.698 g
Contains
less
Sat. Fat Saturated fat
-15.7%
Contains
more
Mono. Fat Monounsaturated fat
+10.5%
Contains
more
Poly. Fat Polyunsaturated fat
+78.9%