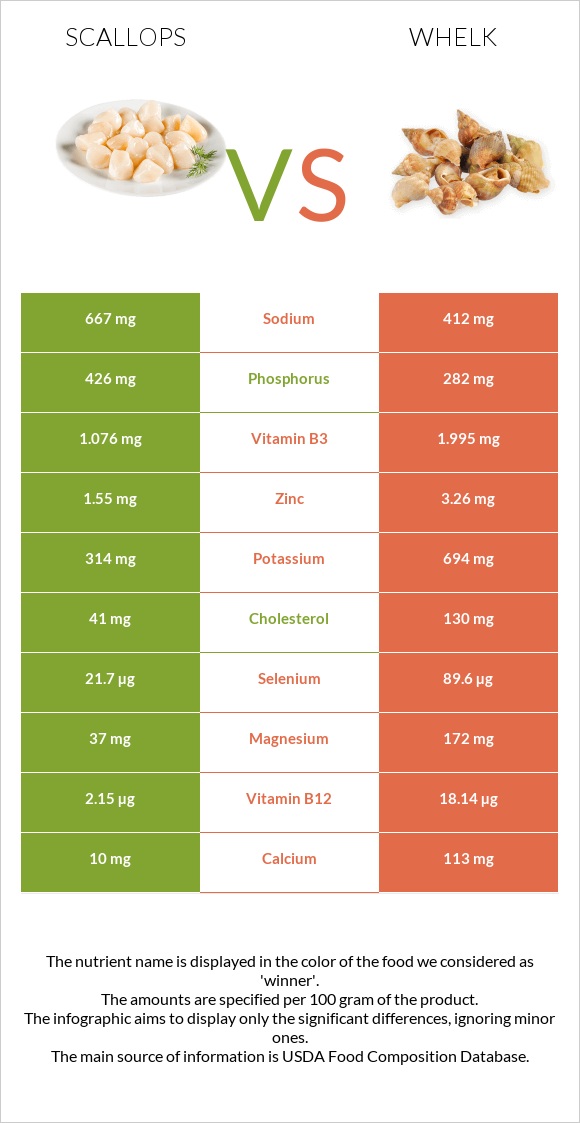
How are scallops and whelk different? Scallops are richer in phosphorus, while whelk is higher in vitamin B12, copper, selenium, iron, vitamin B6, manganese, magnesium, and zinc. Whelk covers your daily need for vitamin B12, 666% more than scallops. Scallops contain 2 times more phosphorus than whelk. Scallops contain 426mg of phosphorus, while whelk contains 282mg. Scallops are lower in cholesterol. Mollusks, scallop, (bay and sea), cooked, steamed and Mollusks, whelk, unspecified, cooked, moist heat types were used in this article.
Infographic
Mineral Comparison
Mineral comparison score is based on the number of minerals by which one or the other food is richer. The "coverage" charts below show how much of the daily needs can be covered by 300 grams of the food.
1
100 g
300 g
3 oz - 85g
Magnesium
Magnesium
Calcium
Calcium
Potassium
Potassium
Iron
Iron
Copper
Copper
Zinc
Zinc
Phosphorus
Phosphorus
Sodium
Sodium
Manganese
Manganese
Selenium
Selenium
26%
3%
28%
22%
11%
42%
183%
87%
3.8%
118%
9
100 g
300 g
3 oz - 85g
Magnesium
Magnesium
Calcium
Calcium
Potassium
Potassium
Iron
Iron
Copper
Copper
Zinc
Zinc
Phosphorus
Phosphorus
Sodium
Sodium
Manganese
Manganese
Selenium
Selenium
123%
34%
61%
377%
687%
89%
121%
54%
116%
489%
Vitamin Comparison
Vitamin comparison score is based on the number of vitamins by which one or the other food is richer. The "coverage" charts below show how much of the daily needs can be covered by 300 grams of the food.
1
100 g
300 g
3 oz - 85g
Vitamin C
Vit. C
Vitamin D
Vit. D
Vitamin A
Vit. A
Vitamin E
Vit. E
Vitamin B1
Vit. B1
Vitamin B2
Vit. B2
Vitamin B3
Vit. B3
Vitamin B5
Vit. B5
Vitamin B6
Vit. B6
Vitamin B12
Vit. B12
Vitamin K
Vit. K
Folate
Folate
0%
0%
0.67%
0%
3%
5.5%
20%
22%
26%
269%
0%
15%
7
100 g
300 g
3 oz - 85g
Vitamin C
Vit. C
Vitamin D
Vit. D
Vitamin A
Vit. A
Vitamin E
Vit. E
Vitamin B1
Vit. B1
Vitamin B2
Vit. B2
Vitamin B3
Vit. B3
Vitamin B5
Vit. B5
Vitamin B6
Vit. B6
Vitamin B12
Vit. B12
Vitamin K
Vit. K
Folate
Folate
23%
0%
16%
0%
12%
49%
37%
24%
150%
2268%
0%
8.3%
All nutrients comparison - raw data values
Nutrient
DV% diff.
Vitamin B12
2.15µg
18.14µg
666%
Copper
0.033mg
2.06mg
225%
Selenium
21.7µg
89.6µg
123%
Iron
0.58mg
10.06mg
119%
Protein
20.54g
47.68g
54%
Vitamin B6
0.112mg
0.65mg
41%
Manganese
0.029mg
0.89mg
37%
Magnesium
37mg
172mg
32%
Cholesterol
41mg
130mg
30%
Phosphorus
426mg
282mg
21%
Choline
110.7mg
20%
Zinc
1.55mg
3.26mg
16%
Vitamin B2
0.024mg
0.214mg
15%
Potassium
314mg
694mg
11%
Sodium
667mg
412mg
11%
Calcium
10mg
113mg
10%
Calories
111kcal
275kcal
8%
Vitamin C
0mg
6.8mg
8%
Vitamin B3
1.076mg
1.995mg
6%
Vitamin A
2µg
49µg
5%
Carbs
5.41g
15.52g
3%
Vitamin B1
0.012mg
0.049mg
3%
Starch
3.69g
2%
Folate
20µg
11µg
2%
Vitamin B5
0.366mg
0.4mg
1%
Saturated fat
0.218g
0.062g
1%
Polyunsaturated fat
0.222g
0.046g
1%
Protein per 100 calories
19g
17g
N/A
Calories per 10 g protein
54kcal
58kcal
N/A
Weight per 100 calories
90g
36g
N/A
Fats
0.84g
0.8g
0%
Net carbs
5.41g
15.52g
N/A
Vitamin D*
2 IU
0%
Trans fat
0.009g
N/A
Monounsaturated fat
0.082g
0.056g
0%
Tryptophan
0.173mg
0.618mg
0%
Threonine
0.629mg
2.136mg
0%
Isoleucine
0.692mg
1.655mg
0%
Leucine
1.226mg
3.807mg
0%
Lysine
1.258mg
2.93mg
0%
Methionine
0.487mg
1.205mg
0%
Phenylalanine
0.597mg
1.648mg
0%
Valine
0.645mg
2.075mg
0%
Histidine
0.314mg
0.977mg
0%
Omega-3 - EPA
0.072g
0.008g
N/A
Omega-3 - DHA
0.104g
0.012g
N/A
Omega-3 - DPA
0.005g
N/A
Omega-6 - Eicosadienoic acid
0.002g
N/A
Macronutrient Comparison
Macronutrient breakdown side-by-side comparison
2
21%
5%
70%
3%
Protein:
20.54 g
Fats:
0.84 g
Carbs:
5.41 g
Water:
70.25 g
Other:
2.96 g
3
48%
16%
32%
4%
Protein:
47.68 g
Fats:
0.8 g
Carbs:
15.52 g
Water:
32 g
Other:
4 g
Contains
more
Water Water
+119.5%
Contains
more
Protein Protein
+132.1%
Contains
more
Carbs Carbs
+186.9%
Contains
more
Other Other
+35.1%
Fat Type Comparison
Fat type breakdown side-by-side comparison
2
42%
16%
43%
Saturated fat:
Sat. Fat
0.218 g
Monounsaturated fat:
Mono. Fat
0.082 g
Polyunsaturated fat:
Poly. Fat
0.222 g
1
38%
34%
28%
Saturated fat:
Sat. Fat
0.062 g
Monounsaturated fat:
Mono. Fat
0.056 g
Polyunsaturated fat:
Poly. Fat
0.046 g
Contains
more
Mono. Fat Monounsaturated fat
+46.4%
Contains
more
Poly. Fat Polyunsaturated fat
+382.6%
Contains
less
Sat. Fat Saturated fat
-71.6%