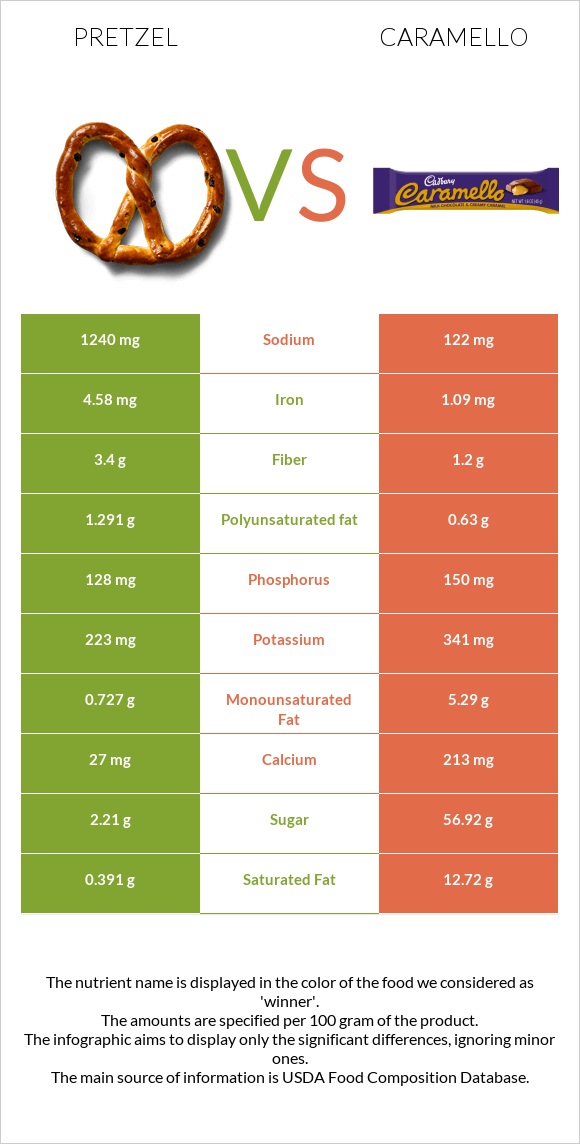
Important differences between pretzel and caramello Pretzel has more iron, fiber, and polyunsaturated fat; however, caramello has more calcium and vitamin A. Caramello's daily need coverage for saturated fat is 62% more. Pretzel has 10 times more sodium than caramello. Pretzel has 1240mg of sodium, while caramello has 122mg. The food varieties used in the comparison are Snacks, pretzels, hard, plain, salted and Candies, CARAMELLO Candy Bar .
Infographic
Mineral Comparison
Mineral comparison score is based on the number of minerals by which one or the other food is richer. The "coverage" charts below show how much of the daily needs can be covered by 300 grams of the food.
6
100 g
300 g
1 oz - 28.35g 10 twists - 60g
Magnesium
Magnesium
Calcium
Calcium
Potassium
Potassium
Iron
Iron
Copper
Copper
Zinc
Zinc
Phosphorus
Phosphorus
Sodium
Sodium
Manganese
Manganese
Selenium
Selenium
21%
8.1%
20%
172%
52%
28%
55%
162%
132%
24%
4
100 g
300 g
1 bar 1.25 oz - 35g 6 blocks - 43g 1 bar 1.6 oz - 45g
Magnesium
Magnesium
Calcium
Calcium
Potassium
Potassium
Iron
Iron
Copper
Copper
Zinc
Zinc
Phosphorus
Phosphorus
Sodium
Sodium
Manganese
Manganese
Selenium
Selenium
0%
64%
30%
41%
0%
0%
64%
16%
0%
0%
Vitamin Comparison
Vitamin comparison score is based on the number of vitamins by which one or the other food is richer. The "coverage" charts below show how much of the daily needs can be covered by 300 grams of the food.
9
100 g
300 g
1 oz - 28.35g 10 twists - 60g
Vitamin C
Vit. C
Vitamin D
Vit. D
Vitamin A
Vit. A
Vitamin E
Vit. E
Vitamin B1
Vit. B1
Vitamin B2
Vit. B2
Vitamin B3
Vit. B3
Vitamin B5
Vit. B5
Vitamin B6
Vit. B6
Vitamin B12
Vit. B12
Vitamin K
Vit. K
Folate
Folate
7%
0%
0%
9.4%
106%
77%
99%
19%
17%
0%
7%
125%
0
100 g
300 g
1 bar 1.25 oz - 35g 6 blocks - 43g 1 bar 1.6 oz - 45g
Vitamin C
Vit. C
Vitamin D
Vit. D
Vitamin A
Vit. A
Vitamin E
Vit. E
Vitamin B1
Vit. B1
Vitamin B2
Vit. B2
Vitamin B3
Vit. B3
Vitamin B5
Vit. B5
Vitamin B6
Vit. B6
Vitamin B12
Vit. B12
Vitamin K
Vit. K
Folate
Folate
5.7%
0%
0%
0%
0%
0%
0%
0%
0%
0%
0%
0%
All nutrients comparison - raw data values
Nutrient
DV% diff.
Saturated fat
0.391g
12.72g
56%
Sodium
1240mg
122mg
49%
Iron
4.58mg
1.09mg
44%
Manganese
1.015mg
44%
Folate
166µg
42%
Vitamin B1
0.424mg
35%
Vitamin B3
5.27mg
33%
Starch
72.58g
30%
Fats
2.93g
21.19g
28%
Vitamin B2
0.332mg
26%
Calcium
27mg
213mg
19%
Copper
0.156mg
17%
Monounsaturated fat
0.727g
5.29g
11%
Cholesterol
0mg
27mg
9%
Fiber
3.4g
1.2g
9%
Zinc
1.04mg
9%
Protein
10.04g
6.19g
8%
Selenium
4.4µg
8%
Magnesium
29mg
7%
Carbs
80.39g
63.81g
6%
Vitamin B5
0.322mg
6%
Vitamin B6
0.074mg
6%
Choline
29.5mg
5%
Calories
384kcal
462kcal
4%
Polyunsaturated fat
1.291g
0.63g
4%
Potassium
223mg
341mg
3%
Phosphorus
128mg
150mg
3%
Vitamin E
0.47mg
3%
Vitamin K
2.8µg
2%
Protein per 100 calories
2.6g
1.3g
N/A
Calories per 10 g protein
382kcal
746kcal
N/A
Weight per 100 calories
26g
22g
N/A
Unsaturated / Saturated Fat ratio
5.2
0.47
N/A
Vitamin C
2.1mg
1.7mg
0%
Net carbs
76.99g
62.61g
N/A
Sugar
2.21g
56.92g
N/A
Trans fat
0.004g
N/A
Tryptophan
0.097mg
0%
Threonine
0.25mg
0%
Isoleucine
0.407mg
0%
Leucine
0.757mg
0%
Lysine
0.257mg
0%
Methionine
0.177mg
0%
Phenylalanine
0.52mg
0%
Valine
0.48mg
0%
Histidine
0.22mg
0%
Fructose
0.31g
0%
Omega-3 - ALA
0.063g
N/A
Omega-6 - Gamma-linoleic acid
0.001g
N/A
Omega-6 - Linoleic acid
1.223g
N/A
Macronutrient Comparison
Macronutrient breakdown side-by-side comparison
3
10%
3%
80%
3%
4%
Protein:
10.04 g
Fats:
2.93 g
Carbs:
80.39 g
Water:
3.13 g
Other:
3.51 g
2
6%
21%
64%
7%
2%
Protein:
6.19 g
Fats:
21.19 g
Carbs:
63.81 g
Water:
6.79 g
Other:
2.02 g
Contains
more
Protein Protein
+62.2%
Contains
more
Carbs Carbs
+26%
Contains
more
Other Other
+73.8%
Contains
more
Fats Fats
+623.2%
Contains
more
Water Water
+116.9%
Fat Type Comparison
Fat type breakdown side-by-side comparison
2
16%
30%
54%
Saturated fat:
Sat. Fat
0.391 g
Monounsaturated fat:
Mono. Fat
0.727 g
Polyunsaturated fat:
Poly. Fat
1.291 g
1
68%
28%
3%
Saturated fat:
Sat. Fat
12.72 g
Monounsaturated fat:
Mono. Fat
5.29 g
Polyunsaturated fat:
Poly. Fat
0.63 g
Contains
less
Sat. Fat Saturated fat
-96.9%
Contains
more
Poly. Fat Polyunsaturated fat
+104.9%
Contains
more
Mono. Fat Monounsaturated fat
+627.6%