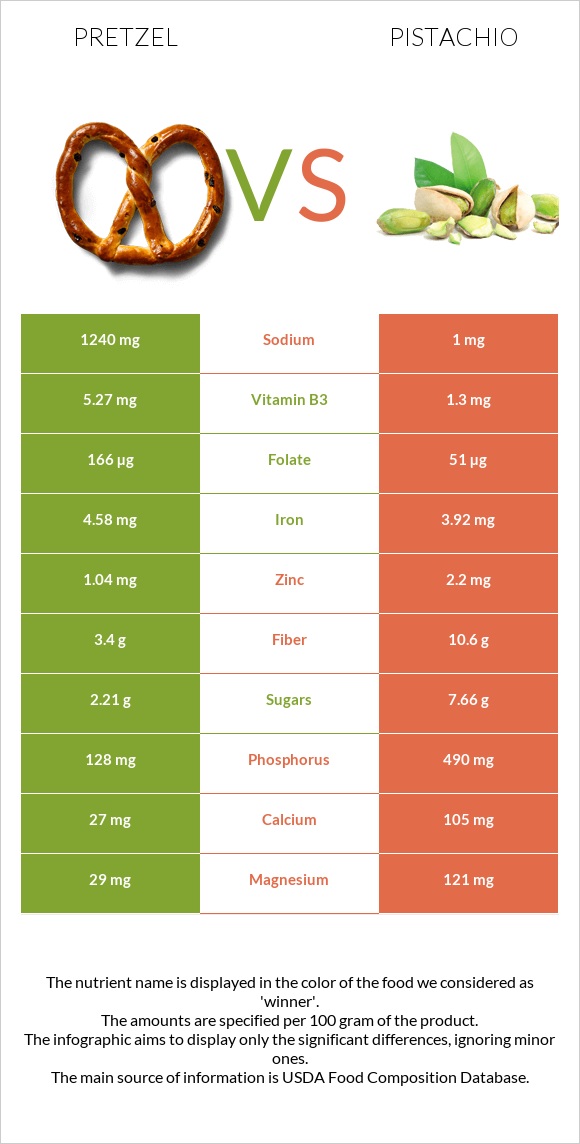
How are pretzel and pistachios different? Pretzel is richer in folate and vitamin B3, while pistachios are higher in copper, vitamin B6, phosphorus, vitamin B1, fiber, and potassium. Pistachios cover your daily need for copper, 127% more than pretzel. Pretzel contains 1240 times more sodium than pistachios. Pretzel contains 1240mg of sodium, while pistachios contain 1mg. Pretzel has a higher glycemic index (83) than pistachios (28). Snacks, pretzels, hard, plain, salted and Nuts, pistachio nuts, raw types were used in this article.
Infographic
Mineral Comparison
Mineral comparison score is based on the number of minerals by which one or the other food is richer. The "coverage" charts below show how much of the daily needs can be covered by 300 grams of the food.
1
100 g
300 g
1 oz - 28.35g 10 twists - 60g
Magnesium
Magnesium
Calcium
Calcium
Potassium
Potassium
Iron
Iron
Copper
Copper
Zinc
Zinc
Phosphorus
Phosphorus
Sodium
Sodium
Manganese
Manganese
Selenium
Selenium
21%
8.1%
20%
172%
52%
28%
55%
162%
132%
24%
9
100 g
300 g
1 kernel - 0.7g 1 oz (49 kernels) - 28.35g 1 cup - 123g
Magnesium
Magnesium
Calcium
Calcium
Potassium
Potassium
Iron
Iron
Copper
Copper
Zinc
Zinc
Phosphorus
Phosphorus
Sodium
Sodium
Manganese
Manganese
Selenium
Selenium
86%
32%
90%
147%
433%
60%
210%
0.13%
157%
38%
Vitamin Comparison
Vitamin comparison score is based on the number of vitamins by which one or the other food is richer. The "coverage" charts below show how much of the daily needs can be covered by 300 grams of the food.
4
100 g
300 g
1 oz - 28.35g 10 twists - 60g
Vitamin C
Vit. C
Vitamin D
Vit. D
Vitamin A
Vit. A
Vitamin E
Vit. E
Vitamin B1
Vit. B1
Vitamin B2
Vit. B2
Vitamin B3
Vit. B3
Vitamin B5
Vit. B5
Vitamin B6
Vit. B6
Vitamin B12
Vit. B12
Vitamin K
Vit. K
Folate
Folate
7%
0%
0%
9.4%
106%
77%
99%
19%
17%
0%
7%
125%
6
100 g
300 g
1 kernel - 0.7g 1 oz (49 kernels) - 28.35g 1 cup - 123g
Vitamin C
Vit. C
Vitamin D
Vit. D
Vitamin A
Vit. A
Vitamin E
Vit. E
Vitamin B1
Vit. B1
Vitamin B2
Vit. B2
Vitamin B3
Vit. B3
Vitamin B5
Vit. B5
Vitamin B6
Vit. B6
Vitamin B12
Vit. B12
Vitamin K
Vit. K
Folate
Folate
19%
0%
8.7%
57%
218%
37%
24%
31%
392%
0%
0%
38%
All nutrients comparison - raw data values
Nutrient
DV% diff.
Copper
0.156mg
1.3mg
127%
Vitamin B6
0.074mg
1.7mg
125%
Polyunsaturated fat
1.291g
14.38g
87%
Fats
2.93g
45.32g
65%
Monounsaturated fat
0.727g
23.257g
56%
Sodium
1240mg
1mg
54%
Phosphorus
128mg
490mg
52%
Vitamin B1
0.424mg
0.87mg
37%
Fiber
3.4g
10.6g
29%
Starch
72.58g
1.67g
29%
Folate
166µg
51µg
29%
Vitamin B3
5.27mg
1.3mg
25%
Saturated fat
0.391g
5.907g
25%
Potassium
223mg
1025mg
24%
Magnesium
29mg
121mg
22%
Protein
10.04g
20.16g
20%
Carbs
80.39g
27.17g
18%
Vitamin E
0.47mg
2.86mg
16%
Vitamin B2
0.332mg
0.16mg
13%
Zinc
1.04mg
2.2mg
11%
Calories
384kcal
560kcal
9%
Calcium
27mg
105mg
8%
Iron
4.58mg
3.92mg
8%
Manganese
1.015mg
1.2mg
8%
Selenium
4.4µg
7µg
5%
Choline
29.5mg
5%
Vitamin C
2.1mg
5.6mg
4%
Vitamin B5
0.322mg
0.52mg
4%
Vitamin A
0µg
26µg
3%
Vitamin K
2.8µg
2%
Protein per 100 calories
2.6g
3.6g
N/A
Calories per 10 g protein
382kcal
278kcal
N/A
Weight per 100 calories
26g
18g
N/A
Unsaturated / Saturated Fat ratio
5.2
6.4
N/A
Net carbs
76.99g
16.57g
N/A
Sugar
2.21g
7.66g
N/A
Trans fat
0.004g
0g
N/A
Tryptophan
0.097mg
0.251mg
0%
Threonine
0.25mg
0.684mg
0%
Isoleucine
0.407mg
0.917mg
0%
Leucine
0.757mg
1.604mg
0%
Lysine
0.257mg
1.138mg
0%
Methionine
0.177mg
0.36mg
0%
Phenylalanine
0.52mg
1.092mg
0%
Valine
0.48mg
1.249mg
0%
Histidine
0.22mg
0.512mg
0%
Fructose
0.31g
0.24g
0%
Omega-3 - ALA
0.063g
N/A
Omega-6 - Gamma-linoleic acid
0.001g
N/A
Omega-6 - Linoleic acid
1.223g
14.091g
N/A
Macronutrient Comparison
Macronutrient breakdown side-by-side comparison
2
10%
3%
80%
3%
4%
Protein:
10.04 g
Fats:
2.93 g
Carbs:
80.39 g
Water:
3.13 g
Other:
3.51 g
3
20%
45%
27%
4%
3%
Protein:
20.16 g
Fats:
45.32 g
Carbs:
27.17 g
Water:
4.37 g
Other:
2.98 g
Contains
more
Carbs Carbs
+195.9%
Contains
more
Other Other
+17.8%
Contains
more
Protein Protein
+100.8%
Contains
more
Fats Fats
+1446.8%
Contains
more
Water Water
+39.6%
Fat Type Comparison
Fat type breakdown side-by-side comparison
1
16%
30%
54%
Saturated fat:
Sat. Fat
0.391 g
Monounsaturated fat:
Mono. Fat
0.727 g
Polyunsaturated fat:
Poly. Fat
1.291 g
2
14%
53%
33%
Saturated fat:
Sat. Fat
5.907 g
Monounsaturated fat:
Mono. Fat
23.257 g
Polyunsaturated fat:
Poly. Fat
14.38 g
Contains
less
Sat. Fat Saturated fat
-93.4%
Contains
more
Mono. Fat Monounsaturated fat
+3099%
Contains
more
Poly. Fat Polyunsaturated fat
+1013.9%
Carbohydrate type comparison
Carbohydrate type breakdown side-by-side comparison
4
97%
Starch:
72.58 g
Sucrose:
0 g
Glucose:
0.69 g
Fructose:
0.31 g
Lactose:
0 g
Maltose:
1.11 g
Galactose:
0 g
1
18%
74%
3%
3%
2%
Starch:
1.67 g
Sucrose:
6.87 g
Glucose:
0.32 g
Fructose:
0.24 g
Lactose:
0 g
Maltose:
0.17 g
Galactose:
0 g
Contains
more
Starch Starch
+4246.1%
Contains
more
Glucose Glucose
+115.6%
Contains
more
Fructose Fructose
+29.2%
Contains
more
Maltose Maltose
+552.9%
Contains
more
Sucrose Sucrose
+∞%
~equal in
Lactose
~0g
~equal in
Galactose
~0g