
Tapioca vs. Rice pudding — In-Depth Nutrition Comparison
Compare
What are the differences between tapioca and rice pudding?
- Rice pudding has a lower glycemic index (59) than tapioca (78).
We used Puddings, tapioca, dry mix, prepared with 2% milk and Puddings, rice, dry mix, prepared with 2% milk types in this article.
Infographic
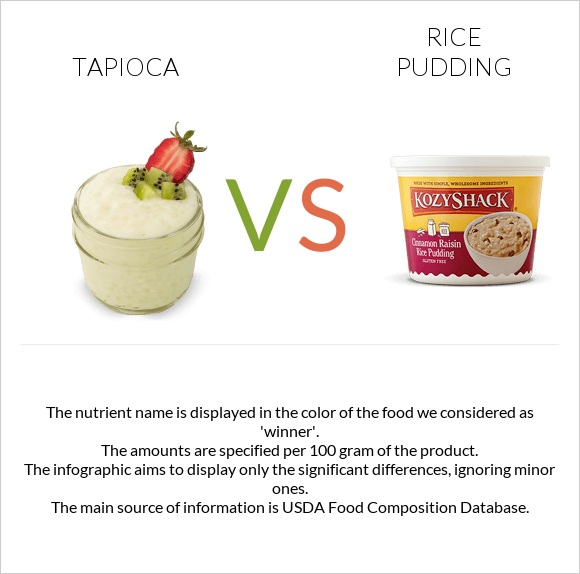
Infographic link
Mineral Comparison
The mineral comparison score is based on which food has a more favorable amount of each mineral. The �coverage� charts below show how much of the daily mineral needs are covered by the selected amount of each food.
| Contains more IronIron | +516.7% |
| Contains more CopperCopper | +50% |
| Contains more ManganeseManganese | +714.3% |
Vitamin Comparison
The vitamin comparison score is based on the number of vitamins in which one food is richer than the other. The �coverage� charts below show how much of the daily vitamin needs are covered by the selected amount of each food.
| Contains more Vitamin DVitamin D | +12.5% |
| Contains more Vitamin B1Vitamin B1 | +150% |
| Contains more Vitamin B3Vitamin B3 | +490.7% |
All nutrients comparison - raw data values
| Nutrient |  |
 |
DV% diff. |
| Iron | 0.06mg | 0.37mg | 4% |
| Vitamin B1 | 0.03mg | 0.075mg | 4% |
| Manganese | 0.007mg | 0.057mg | 2% |
| Vitamin B3 | 0.075mg | 0.443mg | 2% |
| Protein | 2.88g | 3.29g | 1% |
| Vitamin D | 0.9µg | 0.8µg | 1% |
| Copper | 0.012mg | 0.018mg | 1% |
| Phosphorus | 82mg | 87mg | 1% |
| Sodium | 121mg | 109mg | 1% |
| Calories | 105kcal | 111kcal | 0% |
| Protein per 100 calories | 2.7g | 3g | N/A |
| Calories per 10 g protein | 365kcal | 337kcal | N/A |
| Weight per 100 calories | 95g | 90g | N/A |
| Fats | 1.67g | 1.63g | 0% |
| Vitamin C | 0.7mg | 0.7mg | 0% |
| Net carbs | 19.56g | 20.71g | N/A |
| Carbs | 19.56g | 20.81g | 0% |
| Cholesterol | 6mg | 6mg | 0% |
| Vitamin D* | 34 IU | 34 IU | 0% |
| Magnesium | 12mg | 13mg | 0% |
| Calcium | 105mg | 105mg | 0% |
| Potassium | 133mg | 130mg | 0% |
| Fiber | 0g | 0.1g | 0% |
| Zinc | 0.35mg | 0.38mg | 0% |
| Vitamin A | 47µg | 46µg | 0% |
| Selenium | 2µg | 1.9µg | 0% |
| Vitamin B2 | 0.143mg | 0.141mg | 0% |
| Vitamin B5 | 0.277mg | 0.288mg | 0% |
| Vitamin B6 | 0.033mg | 0.035mg | 0% |
| Vitamin B12 | 0.25µg | 0.24µg | 0% |
| Folate | 4µg | 4µg | 0% |
| Saturated fat | 0.991g | 0.967g | 0% |
| Monounsaturated fat | 0.452g | 0.441g | 0% |
| Polyunsaturated fat | 0.061g | 0.06g | 0% |
| Tryptophan | 0.041mg | 0.039mg | 0% |
| Threonine | 0.13mg | 0.126mg | 0% |
| Isoleucine | 0.173mg | 0.169mg | 0% |
| Leucine | 0.282mg | 0.273mg | 0% |
| Lysine | 0.228mg | 0.221mg | 0% |
| Methionine | 0.073mg | 0.07mg | 0% |
| Phenylalanine | 0.139mg | 0.135mg | 0% |
| Valine | 0.192mg | 0.187mg | 0% |
| Histidine | 0.078mg | 0.075mg | 0% |
Macronutrient Comparison
Macronutrient breakdown side-by-side comparison
Protein:
2.88 g
Fats:
1.67 g
Carbs:
19.56 g
Water:
75.01 g
Other:
0.88 g
Protein:
3.29 g
Fats:
1.63 g
Carbs:
20.81 g
Water:
73.43 g
Other:
0.84 g
| Contains more ProteinProtein | +14.2% |
~equal in
Fats
~1.63g
~equal in
Carbs
~20.81g
~equal in
Water
~73.43g
Fat Type Comparison
Fat type breakdown side-by-side comparison
Saturated fat:
Sat. Fat
0.991 g
Monounsaturated fat:
Mono. Fat
0.452 g
Polyunsaturated fat:
Poly. Fat
0.061 g
Saturated fat:
Sat. Fat
0.967 g
Monounsaturated fat:
Mono. Fat
0.441 g
Polyunsaturated fat:
Poly. Fat
0.06 g
~equal in
Saturated fat
~0.967g
~equal in
Monounsaturated fat
~0.441g
~equal in
Polyunsaturated fat
~0.06g


