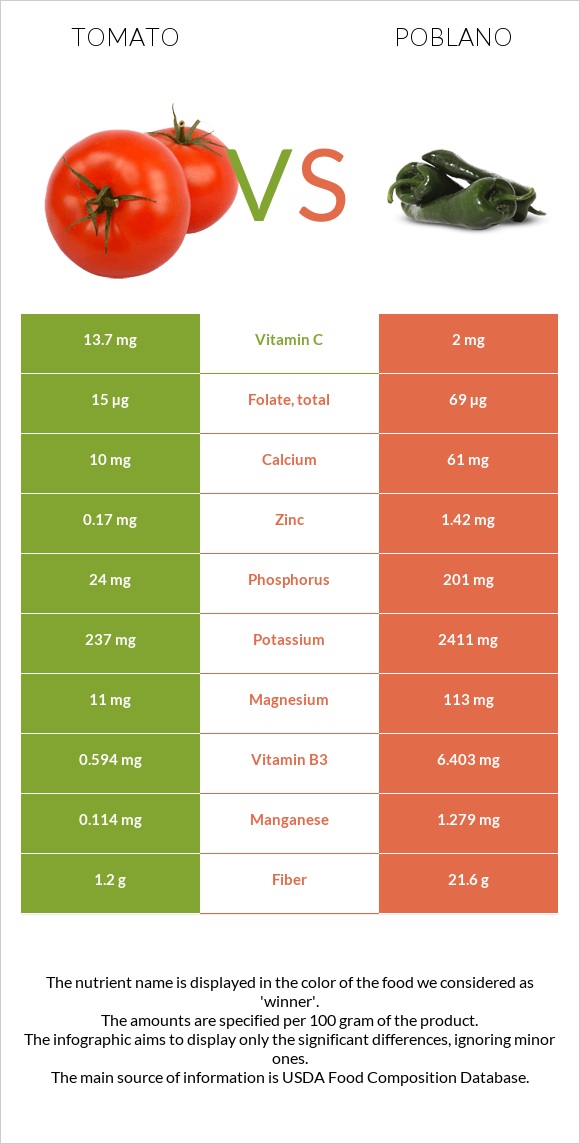
What are the differences between tomatoes and poblano? The amount of vitamin A, vitamin B6, vitamin B2, iron, fiber, potassium, manganese, copper, vitamin B5, and vitamin B3 in poblano is higher than in tomatoes. Poblano's daily need coverage for vitamin A is 392% more. We used Tomatoes, red, ripe, raw, year round average and Peppers, ancho, dried types in this article.
Infographic
Mineral Comparison
Mineral comparison score is based on the number of minerals by which one or the other food is richer. The "coverage" charts below show how much of the daily needs can be covered by 300 grams of the food.
1
100 g
300 g
1 slice, thin/small - 15g 1 cherry - 17g 1 slice, medium (1/4" thick) - 20g 1 slice, thick/large (1/2" thick) - 27g 1 wedge (1/4 of medium tomato) - 31g 1 Italian tomato - 62g 1 plum tomato - 62g 1 small whole (2-2/5" dia) - 91g 1 medium whole (2-3/5" dia) - 123g 1 NLEA serving - 148g 1 cup cherry tomatoes - 149g 1 cup, chopped or sliced - 180g 1 large whole (3" dia) - 182g
Magnesium
Magnesium
Calcium
Calcium
Potassium
Potassium
Iron
Iron
Copper
Copper
Zinc
Zinc
Phosphorus
Phosphorus
Sodium
Sodium
Manganese
Manganese
Selenium
Selenium
7.9%
3%
21%
10%
20%
4.6%
10%
0.65%
15%
0%
9
100 g
300 g
1 pepper - 17g
Magnesium
Magnesium
Calcium
Calcium
Potassium
Potassium
Iron
Iron
Copper
Copper
Zinc
Zinc
Phosphorus
Phosphorus
Sodium
Sodium
Manganese
Manganese
Selenium
Selenium
81%
18%
213%
410%
169%
39%
86%
5.6%
167%
16%
Vitamin Comparison
Vitamin comparison score is based on the number of vitamins by which one or the other food is richer. The "coverage" charts below show how much of the daily needs can be covered by 300 grams of the food.
3
100 g
300 g
1 slice, thin/small - 15g 1 cherry - 17g 1 slice, medium (1/4" thick) - 20g 1 slice, thick/large (1/2" thick) - 27g 1 wedge (1/4 of medium tomato) - 31g 1 Italian tomato - 62g 1 plum tomato - 62g 1 small whole (2-2/5" dia) - 91g 1 medium whole (2-3/5" dia) - 123g 1 NLEA serving - 148g 1 cup cherry tomatoes - 149g 1 cup, chopped or sliced - 180g 1 large whole (3" dia) - 182g
Vitamin C
Vit. C
Vitamin D
Vit. D
Vitamin A
Vit. A
Vitamin E
Vit. E
Vitamin B1
Vit. B1
Vitamin B2
Vit. B2
Vitamin B3
Vit. B3
Vitamin B5
Vit. B5
Vitamin B6
Vit. B6
Vitamin B12
Vit. B12
Vitamin K
Vit. K
Folate
Folate
46%
0%
14%
11%
9.3%
4.4%
11%
5.3%
18%
0%
20%
11%
7
100 g
300 g
1 pepper - 17g
Vitamin C
Vit. C
Vitamin D
Vit. D
Vitamin A
Vit. A
Vitamin E
Vit. E
Vitamin B1
Vit. B1
Vitamin B2
Vit. B2
Vitamin B3
Vit. B3
Vitamin B5
Vit. B5
Vitamin B6
Vit. B6
Vitamin B12
Vit. B12
Vitamin K
Vit. K
Folate
Folate
6.7%
0%
341%
0%
45%
520%
120%
120%
816%
0%
0%
52%
All nutrients comparison - raw data values
Nutrient
DV% diff.
Vitamin B6
0.08mg
3.535mg
266%
Vitamin B2
0.019mg
2.255mg
172%
Iron
0.27mg
10.93mg
133%
Vitamin A
42µg
1022µg
109%
Fiber
1.2g
21.6g
82%
Potassium
237mg
2411mg
64%
Manganese
0.114mg
1.279mg
51%
Copper
0.059mg
0.508mg
50%
Vitamin B5
0.089mg
1.993mg
38%
Vitamin B3
0.594mg
6.403mg
36%
Polyunsaturated fat
0.083g
4.511g
30%
Phosphorus
24mg
201mg
25%
Magnesium
11mg
113mg
24%
Protein
0.88g
11.86g
22%
Carbs
3.89g
51.42g
16%
Folate
15µg
69µg
14%
Calories
18kcal
281kcal
13%
Vitamin C
13.7mg
2mg
13%
Fats
0.2g
8.2g
12%
Vitamin B1
0.037mg
0.179mg
12%
Zinc
0.17mg
1.42mg
11%
Vitamin K
7.9µg
7%
Calcium
10mg
61mg
5%
Selenium
0µg
2.9µg
5%
Vitamin E
0.54mg
4%
Saturated fat
0.028g
0.82g
4%
Sodium
5mg
43mg
2%
Fructose
1.37g
2%
Choline
6.7mg
1%
Monounsaturated fat
0.031g
0.492g
1%
Protein per 100 calories
4.9g
4.2g
N/A
Calories per 10 g protein
205kcal
237kcal
N/A
Weight per 100 calories
556g
36g
N/A
Unsaturated / Saturated Fat ratio
4.1
6.1
N/A
Net carbs
2.69g
29.82g
N/A
Sugar
2.63g
N/A
Tryptophan
0.006mg
0.155mg
0%
Threonine
0.027mg
0.425mg
0%
Isoleucine
0.018mg
0.373mg
0%
Leucine
0.025mg
0.605mg
0%
Lysine
0.027mg
0.515mg
0%
Methionine
0.006mg
0.142mg
0%
Phenylalanine
0.027mg
0.361mg
0%
Valine
0.018mg
0.489mg
0%
Histidine
0.014mg
0.232mg
0%
Macronutrient Comparison
Macronutrient breakdown side-by-side comparison
1
4%
95%
Protein:
0.88 g
Fats:
0.2 g
Carbs:
3.89 g
Water:
94.52 g
Other:
0.51 g
4
12%
8%
51%
23%
6%
Protein:
11.86 g
Fats:
8.2 g
Carbs:
51.42 g
Water:
22.63 g
Other:
5.89 g
Contains
more
Water Water
+317.7%
Contains
more
Protein Protein
+1247.7%
Contains
more
Fats Fats
+4000%
Contains
more
Carbs Carbs
+1221.9%
Contains
more
Other Other
+1054.9%
Fat Type Comparison
Fat type breakdown side-by-side comparison
1
20%
22%
58%
Saturated fat:
Sat. Fat
0.028 g
Monounsaturated fat:
Mono. Fat
0.031 g
Polyunsaturated fat:
Poly. Fat
0.083 g
2
14%
8%
77%
Saturated fat:
Sat. Fat
0.82 g
Monounsaturated fat:
Mono. Fat
0.492 g
Polyunsaturated fat:
Poly. Fat
4.511 g
Contains
less
Sat. Fat Saturated fat
-96.6%
Contains
more
Mono. Fat Monounsaturated fat
+1487.1%
Contains
more
Poly. Fat Polyunsaturated fat
+5334.9%