
Vine spinach (basella) vs. Dill — In-Depth Nutrition Comparison
Compare
Important differences between vine spinach (basella) and dill
- Vine spinach (basella) has more vitamin C; however, dill has more iron, manganese, vitamin B2, calcium, vitamin B5, potassium, and vitamin B3.
- Dill's daily need coverage for iron is 67% more.
The food varieties used in the comparison are Vinespinach, (basella), raw and Dill weed, fresh.
Infographic
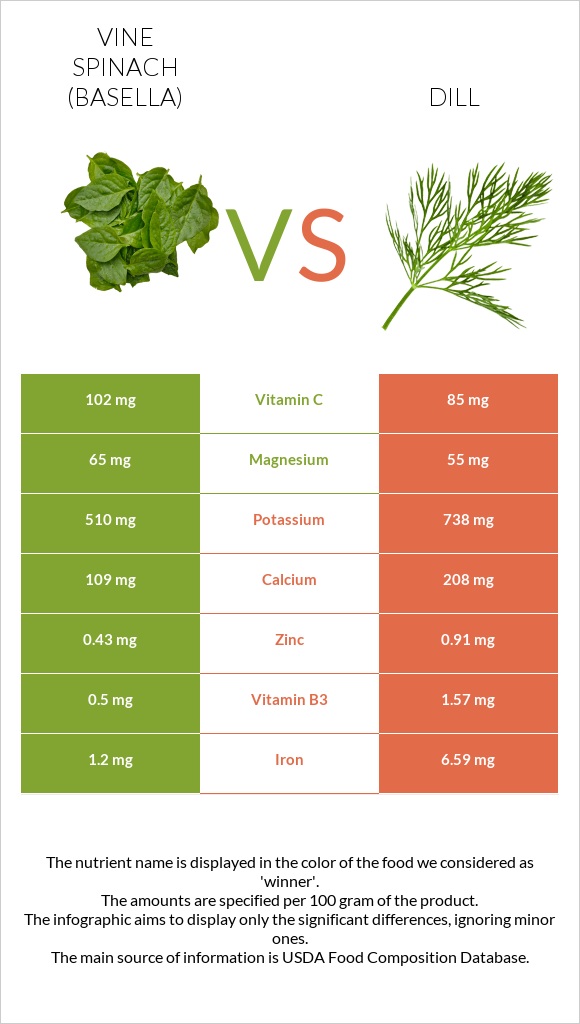
Infographic link
Mineral Comparison
The mineral comparison score is based on which food has a more favorable amount of each mineral. The �coverage� charts below show how much of the daily mineral needs are covered by the selected amount of each food.
| Contains more MagnesiumMagnesium | +18.2% |
| Contains less SodiumSodium | -60.7% |
| Contains more SeleniumSelenium | +∞% |
| Contains more CalciumCalcium | +90.8% |
| Contains more PotassiumPotassium | +44.7% |
| Contains more IronIron | +449.2% |
| Contains more CopperCopper | +36.4% |
| Contains more ZincZinc | +111.6% |
| Contains more PhosphorusPhosphorus | +26.9% |
| Contains more ManganeseManganese | +72% |
Vitamin Comparison
The vitamin comparison score is based on the number of vitamins in which one food is richer than the other. The �coverage� charts below show how much of the daily vitamin needs are covered by the selected amount of each food.
| Contains more Vitamin CVitamin C | +20% |
| Contains more Vitamin B6Vitamin B6 | +29.7% |
| Contains more Vitamin B1Vitamin B1 | +16% |
| Contains more Vitamin B2Vitamin B2 | +91% |
| Contains more Vitamin B3Vitamin B3 | +214% |
| Contains more Vitamin B5Vitamin B5 | +649.1% |
All nutrients comparison - raw data values
| Nutrient |  |
 |
DV% diff. |
| Iron | 1.2mg | 6.59mg | 67% |
| Manganese | 0.735mg | 1.264mg | 23% |
| Vitamin C | 102mg | 85mg | 19% |
| Vitamin B2 | 0.155mg | 0.296mg | 11% |
| Calcium | 109mg | 208mg | 10% |
| Fiber | 2.1g | 8% | |
| Potassium | 510mg | 738mg | 7% |
| Vitamin B3 | 0.5mg | 1.57mg | 7% |
| Vitamin B5 | 0.053mg | 0.397mg | 7% |
| Copper | 0.107mg | 0.146mg | 4% |
| Zinc | 0.43mg | 0.91mg | 4% |
| Vitamin B6 | 0.24mg | 0.185mg | 4% |
| Protein | 1.8g | 3.46g | 3% |
| Folate | 140µg | 150µg | 3% |
| Magnesium | 65mg | 55mg | 2% |
| Phosphorus | 52mg | 66mg | 2% |
| Sodium | 24mg | 61mg | 2% |
| Vitamin A | 400µg | 386µg | 2% |
| Monounsaturated fat | 0.802g | 2% | |
| Calories | 19kcal | 43kcal | 1% |
| Fats | 0.3g | 1.12g | 1% |
| Carbs | 3.4g | 7.02g | 1% |
| Selenium | 0.8µg | 1% | |
| Vitamin B1 | 0.05mg | 0.058mg | 1% |
| Polyunsaturated fat | 0.095g | 1% | |
| Protein per 100 calories | 9.5g | 8g | N/A |
| Calories per 10 g protein | 106kcal | 124kcal | N/A |
| Weight per 100 calories | 526g | 233g | N/A |
| Net carbs | 3.4g | 4.92g | N/A |
| Saturated fat | 0.06g | 0% | |
| Tryptophan | 0.028mg | 0.014mg | 0% |
| Threonine | 0.055mg | 0.068mg | 0% |
| Isoleucine | 0.053mg | 0.195mg | 0% |
| Leucine | 0.101mg | 0.159mg | 0% |
| Lysine | 0.086mg | 0.246mg | 0% |
| Methionine | 0.019mg | 0.011mg | 0% |
| Phenylalanine | 0.085mg | 0.065mg | 0% |
| Valine | 0.065mg | 0.154mg | 0% |
| Histidine | 0.039mg | 0.071mg | 0% |
Macronutrient Comparison
Macronutrient breakdown side-by-side comparison
Protein:
1.8 g
Fats:
0.3 g
Carbs:
3.4 g
Water:
93.1 g
Other:
1.4 g
Protein:
3.46 g
Fats:
1.12 g
Carbs:
7.02 g
Water:
85.95 g
Other:
2.45 g
| Contains more ProteinProtein | +92.2% |
| Contains more FatsFats | +273.3% |
| Contains more CarbsCarbs | +106.5% |
~equal in
Water
~85.95g


