Pollock vs. Ham — In-Depth Nutrition Comparison
Compare
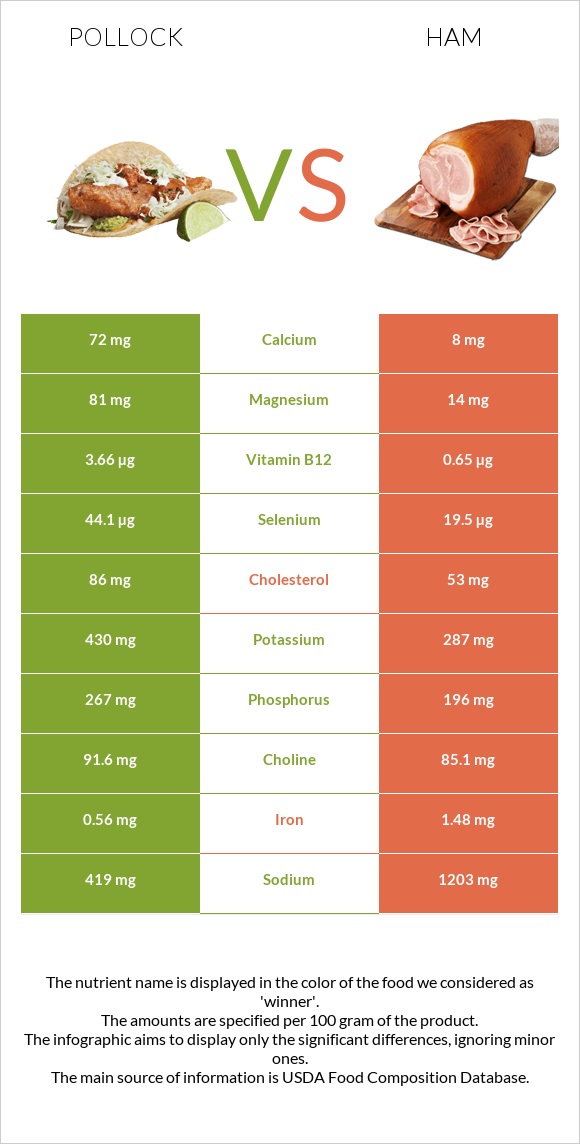
Differences between pollock and ham
- Pollock has more vitamin B12, selenium, magnesium, and phosphorus, while ham has more vitamin B1, zinc, and iron.
- Pollock's daily need coverage for vitamin B12 is 125% higher.
- Ham contains 6 times less magnesium than pollock. Pollock contains 81mg of magnesium, while ham contains 14mg.
- The amount of cholesterol in ham is lower.
The food types used in this comparison are Fish, pollock, Alaska, cooked, dry heat (may have been previously frozen) and Pork, cured, ham, boneless, extra lean (approximately 5% fat), roasted.
Infographic
Infographic link
Mineral Comparison
Mineral comparison score is based on the number of minerals by which one or the other food is richer. The "coverage" charts below show how much of the daily needs can be covered by 300 grams of the food.
| Contains more MagnesiumMagnesium | +478.6% |
| Contains more CalciumCalcium | +800% |
| Contains more PotassiumPotassium | +49.8% |
| Contains more PhosphorusPhosphorus | +36.2% |
| Contains less SodiumSodium | -65.2% |
| Contains more SeleniumSelenium | +126.2% |
| Contains more IronIron | +164.3% |
| Contains more CopperCopper | +31.7% |
| Contains more ZincZinc | +405.3% |
| Contains more ManganeseManganese | +200% |
Vitamin Comparison
Vitamin comparison score is based on the number of vitamins by which one or the other food is richer. The "coverage" charts below show how much of the daily needs can be covered by 300 grams of the food.
| Contains more Vitamin AVitamin A | +∞% |
| Contains more Vitamin EVitamin E | +12% |
| Contains more Vitamin DVitamin D | +62.5% |
| Contains more Vitamin B12Vitamin B12 | +463.1% |
| Contains more Vitamin KVitamin K | +∞% |
| Contains more Vitamin B1Vitamin B1 | +1296.3% |
| Contains more Vitamin B6Vitamin B6 | +21.6% |
All nutrients comparison - raw data values
| Nutrient |  |
 |
DV% diff. |
| Vitamin B12 | 3.66µg | 0.65µg | 125% |
| Vitamin B1 | 0.054mg | 0.754mg | 58% |
| Selenium | 44.1µg | 19.5µg | 45% |
| Sodium | 419mg | 1203mg | 34% |
| Zinc | 0.57mg | 2.88mg | 21% |
| Magnesium | 81mg | 14mg | 16% |
| Iron | 0.56mg | 1.48mg | 12% |
| Cholesterol | 86mg | 53mg | 11% |
| Phosphorus | 267mg | 196mg | 10% |
| Saturated fat | 0.159g | 1.81g | 8% |
| Fats | 1.18g | 5.53g | 7% |
| Calcium | 72mg | 8mg | 6% |
| Monounsaturated fat | 0.134g | 2.62g | 6% |
| Protein | 23.48g | 20.93g | 5% |
| Vitamin B6 | 0.329mg | 0.4mg | 5% |
| Potassium | 430mg | 287mg | 4% |
| Vitamin D | 1.3µg | 0.8µg | 3% |
| Calories | 111kcal | 145kcal | 2% |
| Vitamin D | 51 IU | 32 IU | 2% |
| Copper | 0.06mg | 0.079mg | 2% |
| Vitamin A | 17µg | 0µg | 2% |
| Manganese | 0.018mg | 0.054mg | 2% |
| Vitamin B2 | 0.223mg | 0.202mg | 2% |
| Carbs | 0g | 1.5g | 1% |
| Vitamin B5 | 0.432mg | 0.403mg | 1% |
| Choline | 91.6mg | 85.1mg | 1% |
| Net carbs | 0g | 1.5g | N/A |
| Vitamin E | 0.28mg | 0.25mg | 0% |
| Vitamin B3 | 3.949mg | 4.023mg | 0% |
| Vitamin K | 0.1µg | 0µg | 0% |
| Folate | 3µg | 3µg | 0% |
| Polyunsaturated fat | 0.583g | 0.54g | 0% |
| Tryptophan | 0.263mg | 0.251mg | 0% |
| Threonine | 1.029mg | 0.931mg | 0% |
| Isoleucine | 1.082mg | 0.918mg | 0% |
| Leucine | 1.908mg | 1.661mg | 0% |
| Lysine | 2.157mg | 1.775mg | 0% |
| Methionine | 0.696mg | 0.553mg | 0% |
| Phenylalanine | 0.917mg | 0.904mg | 0% |
| Valine | 1.21mg | 0.908mg | 0% |
| Histidine | 0.691mg | 0.75mg | 0% |
| Omega-3 - EPA | 0.086g | 0g | N/A |
| Omega-3 - DHA | 0.423g | 0g | N/A |
| Omega-3 - DPA | 0.027g | 0g | N/A |
Macronutrient Comparison
Macronutrient breakdown side-by-side comparison
| Contains more ProteinProtein | +12.2% |
| Contains more FatsFats | +368.6% |
| Contains more CarbsCarbs | +∞% |
| Contains more OtherOther | +158.6% |
~equal in
Water
~67.67g
Fat Type Comparison
Fat type breakdown side-by-side comparison
| Contains less Sat. FatSaturated fat | -91.2% |
| Contains more Mono. FatMonounsaturated fat | +1855.2% |
~equal in
Polyunsaturated fat
~0.54g


