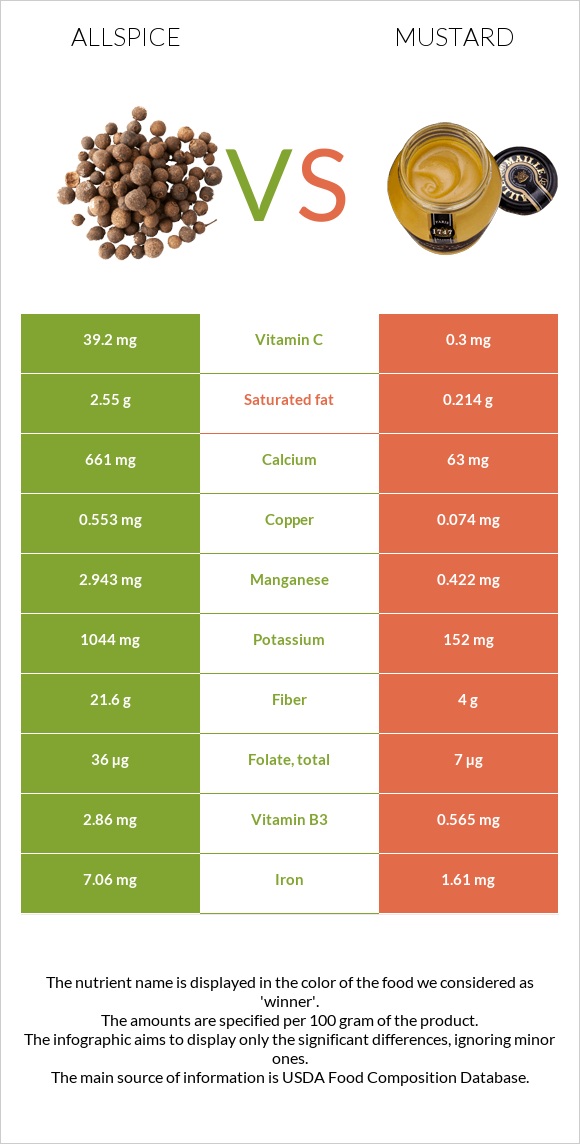
What are the differences between allspice and mustard? Allspice is higher in manganese, fiber, iron, calcium, copper, vitamin C, potassium, and magnesium, yet mustard is higher in selenium. Allspice's daily need coverage for manganese is 110% more. Allspice has 131 times more vitamin C than mustard. While allspice has 39.2mg of vitamin C, mustard has only 0.3mg. The amount of sodium in allspice is lower. The glycemic index of allspice is lower. We used Spices, allspice, ground and Mustard, prepared, yellow types in this article.
Infographic
Mineral Comparison
Mineral comparison score is based on the number of minerals by which one or the other food is richer. The "coverage" charts below show how much of the daily needs can be covered by 300 grams of the food.
8
100 g
300 g
0.25 tsp - 0.5g 1 tsp - 1.9g 1 tbsp - 6g
Magnesium
Magnesium
Calcium
Calcium
Potassium
Potassium
Iron
Iron
Copper
Copper
Zinc
Zinc
Phosphorus
Phosphorus
Sodium
Sodium
Manganese
Manganese
Selenium
Selenium
96%
198%
92%
265%
184%
28%
48%
10%
384%
15%
1
100 g
300 g
1 tsp or 1 packet - 5g 1 cup - 249g
Magnesium
Magnesium
Calcium
Calcium
Potassium
Potassium
Iron
Iron
Copper
Copper
Zinc
Zinc
Phosphorus
Phosphorus
Sodium
Sodium
Manganese
Manganese
Selenium
Selenium
34%
19%
13%
60%
25%
17%
46%
144%
55%
183%
Vitamin Comparison
Vitamin comparison score is based on the number of vitamins by which one or the other food is richer. The "coverage" charts below show how much of the daily needs can be covered by 300 grams of the food.
5
100 g
300 g
0.25 tsp - 0.5g 1 tsp - 1.9g 1 tbsp - 6g
Vitamin C
Vit. C
Vitamin D
Vit. D
Vitamin A
Vit. A
Vitamin E
Vit. E
Vitamin B1
Vit. B1
Vitamin B2
Vit. B2
Vitamin B3
Vit. B3
Vitamin B5
Vit. B5
Vitamin B6
Vit. B6
Vitamin B12
Vit. B12
Vitamin K
Vit. K
Folate
Folate
131%
0%
9%
0%
25%
15%
54%
0%
48%
0%
0%
27%
5
100 g
300 g
1 tsp or 1 packet - 5g 1 cup - 249g
Vitamin C
Vit. C
Vitamin D
Vit. D
Vitamin A
Vit. A
Vitamin E
Vit. E
Vitamin B1
Vit. B1
Vitamin B2
Vit. B2
Vitamin B3
Vit. B3
Vitamin B5
Vit. B5
Vitamin B6
Vit. B6
Vitamin B12
Vit. B12
Vitamin K
Vit. K
Folate
Folate
1%
0%
1.7%
7.2%
44%
16%
11%
15%
16%
0%
3.5%
5.3%
All nutrients comparison - raw data values
Nutrient
DV% diff.
Manganese
2.943mg
0.422mg
110%
Fiber
21.6g
4g
70%
Iron
7.06mg
1.61mg
68%
Calcium
661mg
63mg
60%
Selenium
2.7µg
33.5µg
56%
Copper
0.553mg
0.074mg
53%
Sodium
77mg
1104mg
45%
Vitamin C
39.2mg
0.3mg
43%
Potassium
1044mg
152mg
26%
Carbs
72.12g
5.83g
22%
Magnesium
135mg
48mg
21%
Vitamin B3
2.86mg
0.565mg
14%
Vitamin B6
0.21mg
0.07mg
11%
Saturated fat
2.55g
0.214g
11%
Polyunsaturated fat
2.36g
0.774g
11%
Calories
263kcal
60kcal
10%
Fats
8.69g
3.34g
8%
Folate
36µg
7µg
7%
Vitamin B1
0.101mg
0.177mg
6%
Protein
6.09g
3.74g
5%
Vitamin B5
0.254mg
5%
Choline
22.4mg
4%
Monounsaturated fat
0.66g
2.182g
4%
Zinc
1.01mg
0.64mg
3%
Vitamin A
27µg
5µg
2%
Vitamin E
0.36mg
2%
Phosphorus
113mg
108mg
1%
Vitamin B2
0.063mg
0.07mg
1%
Vitamin K
1.4µg
1%
Protein per 100 calories
2.3g
6.2g
N/A
Calories per 10 g protein
432kcal
160kcal
N/A
Weight per 100 calories
38g
167g
N/A
Unsaturated / Saturated Fat ratio
1.2
14
N/A
Net carbs
50.52g
1.83g
N/A
Sugar
0.92g
N/A
Starch
0.64g
0%
Trans fat
0g
0.009g
N/A
Tryptophan
0.009mg
0%
Threonine
0.167mg
0%
Isoleucine
0.146mg
0%
Leucine
0.292mg
0%
Lysine
0.264mg
0%
Methionine
0.076mg
0%
Phenylalanine
0.161mg
0%
Valine
0.189mg
0%
Histidine
0.119mg
0%
Fructose
0.23g
0%
Omega-3 - ALA
0.373g
N/A
Omega-3 - Eicosatrienoic acid
0.018g
N/A
Omega-6 - Eicosadienoic acid
0.01g
N/A
Omega-6 - Linoleic acid
0.358g
N/A
Macronutrient Comparison
Macronutrient breakdown side-by-side comparison
4
6%
9%
72%
8%
5%
Protein:
6.09 g
Fats:
8.69 g
Carbs:
72.12 g
Water:
8.46 g
Other:
4.64 g
1
4%
3%
6%
84%
3%
Protein:
3.74 g
Fats:
3.34 g
Carbs:
5.83 g
Water:
83.72 g
Other:
3.37 g
Contains
more
Protein Protein
+62.8%
Contains
more
Fats Fats
+160.2%
Contains
more
Carbs Carbs
+1137%
Contains
more
Other Other
+37.7%
Contains
more
Water Water
+889.6%
Fat Type Comparison
Fat type breakdown side-by-side comparison
1
46%
12%
42%
Saturated fat:
Sat. Fat
2.55 g
Monounsaturated fat:
Mono. Fat
0.66 g
Polyunsaturated fat:
Poly. Fat
2.36 g
2
7%
69%
24%
Saturated fat:
Sat. Fat
0.214 g
Monounsaturated fat:
Mono. Fat
2.182 g
Polyunsaturated fat:
Poly. Fat
0.774 g
Contains
more
Poly. Fat Polyunsaturated fat
+204.9%
Contains
less
Sat. Fat Saturated fat
-91.6%
Contains
more
Mono. Fat Monounsaturated fat
+230.6%